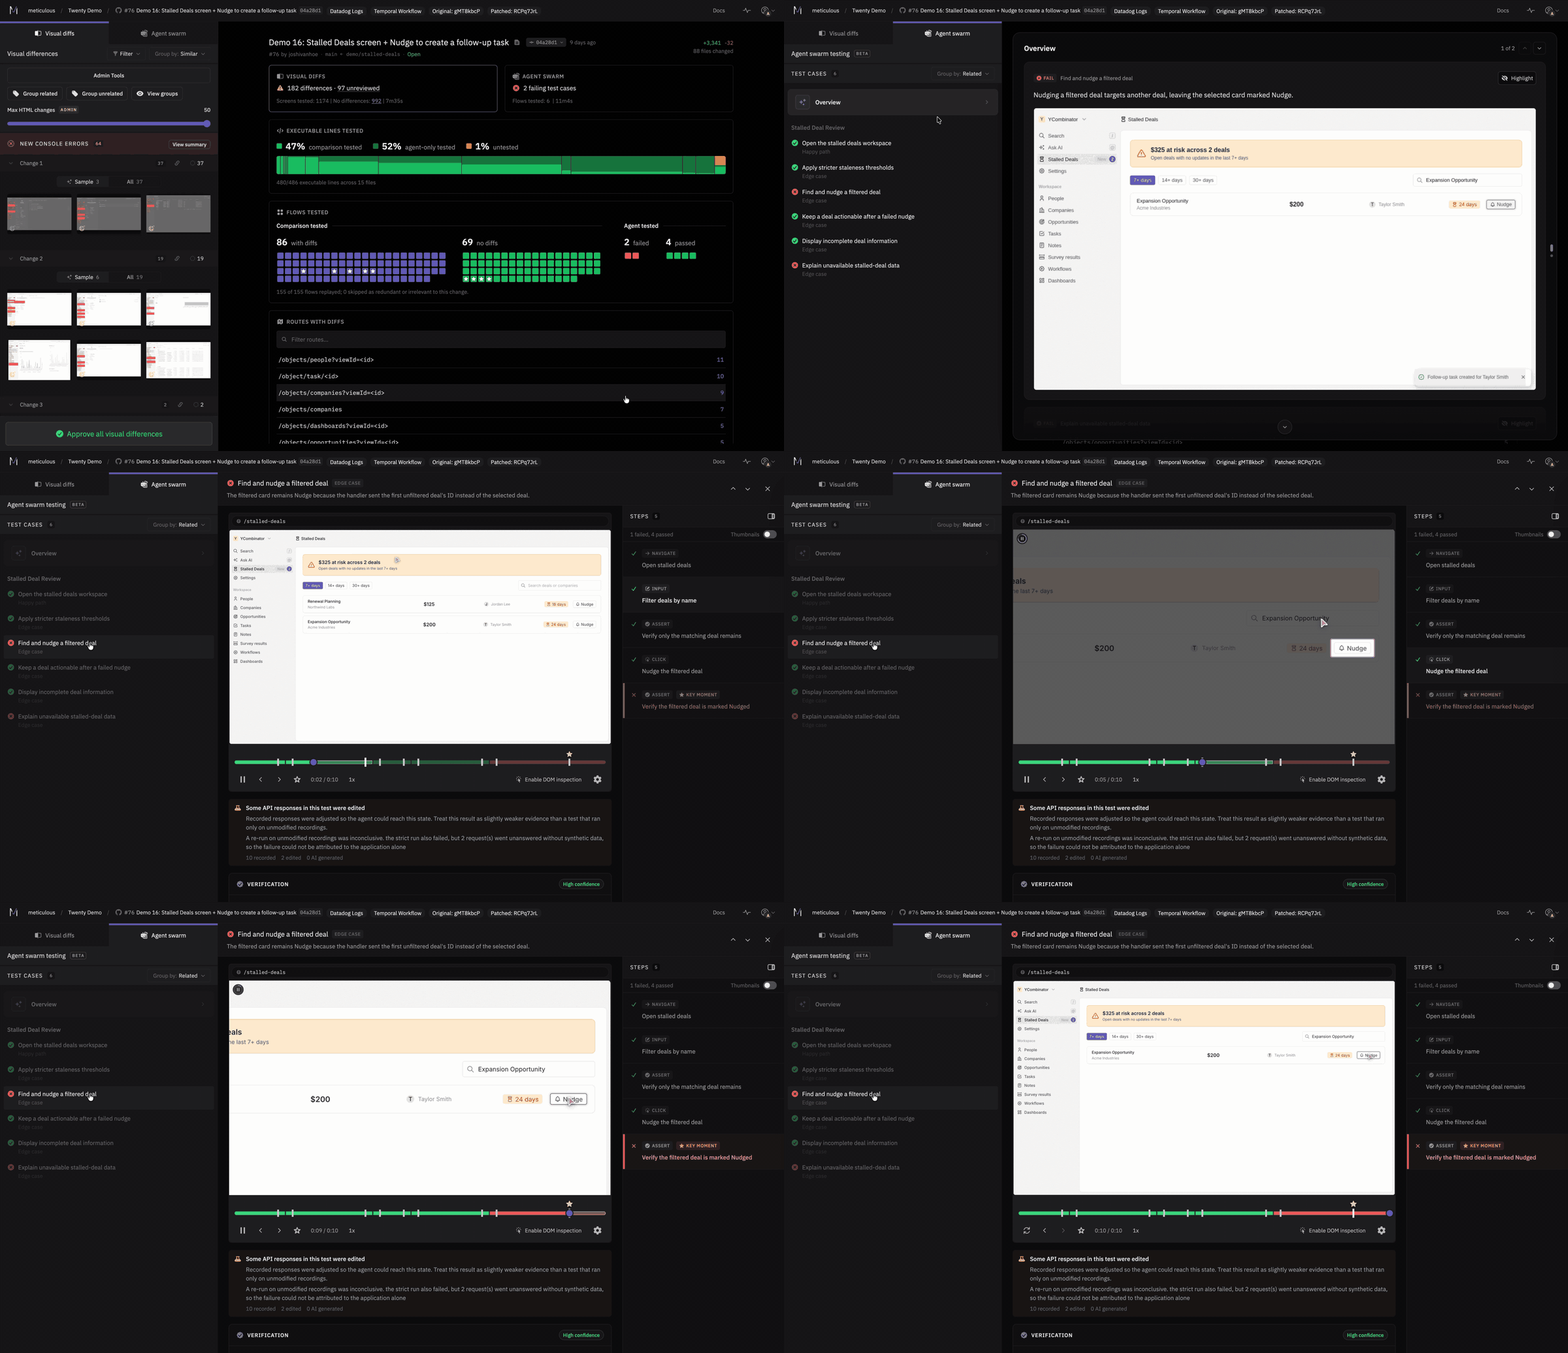
Agent Skills, custom checks, and backend record & replay

Agent Skills, FE performance regression detection and custom checks, comment on diffs, backend record & replay, and more.

πŸ€– Agent Skills

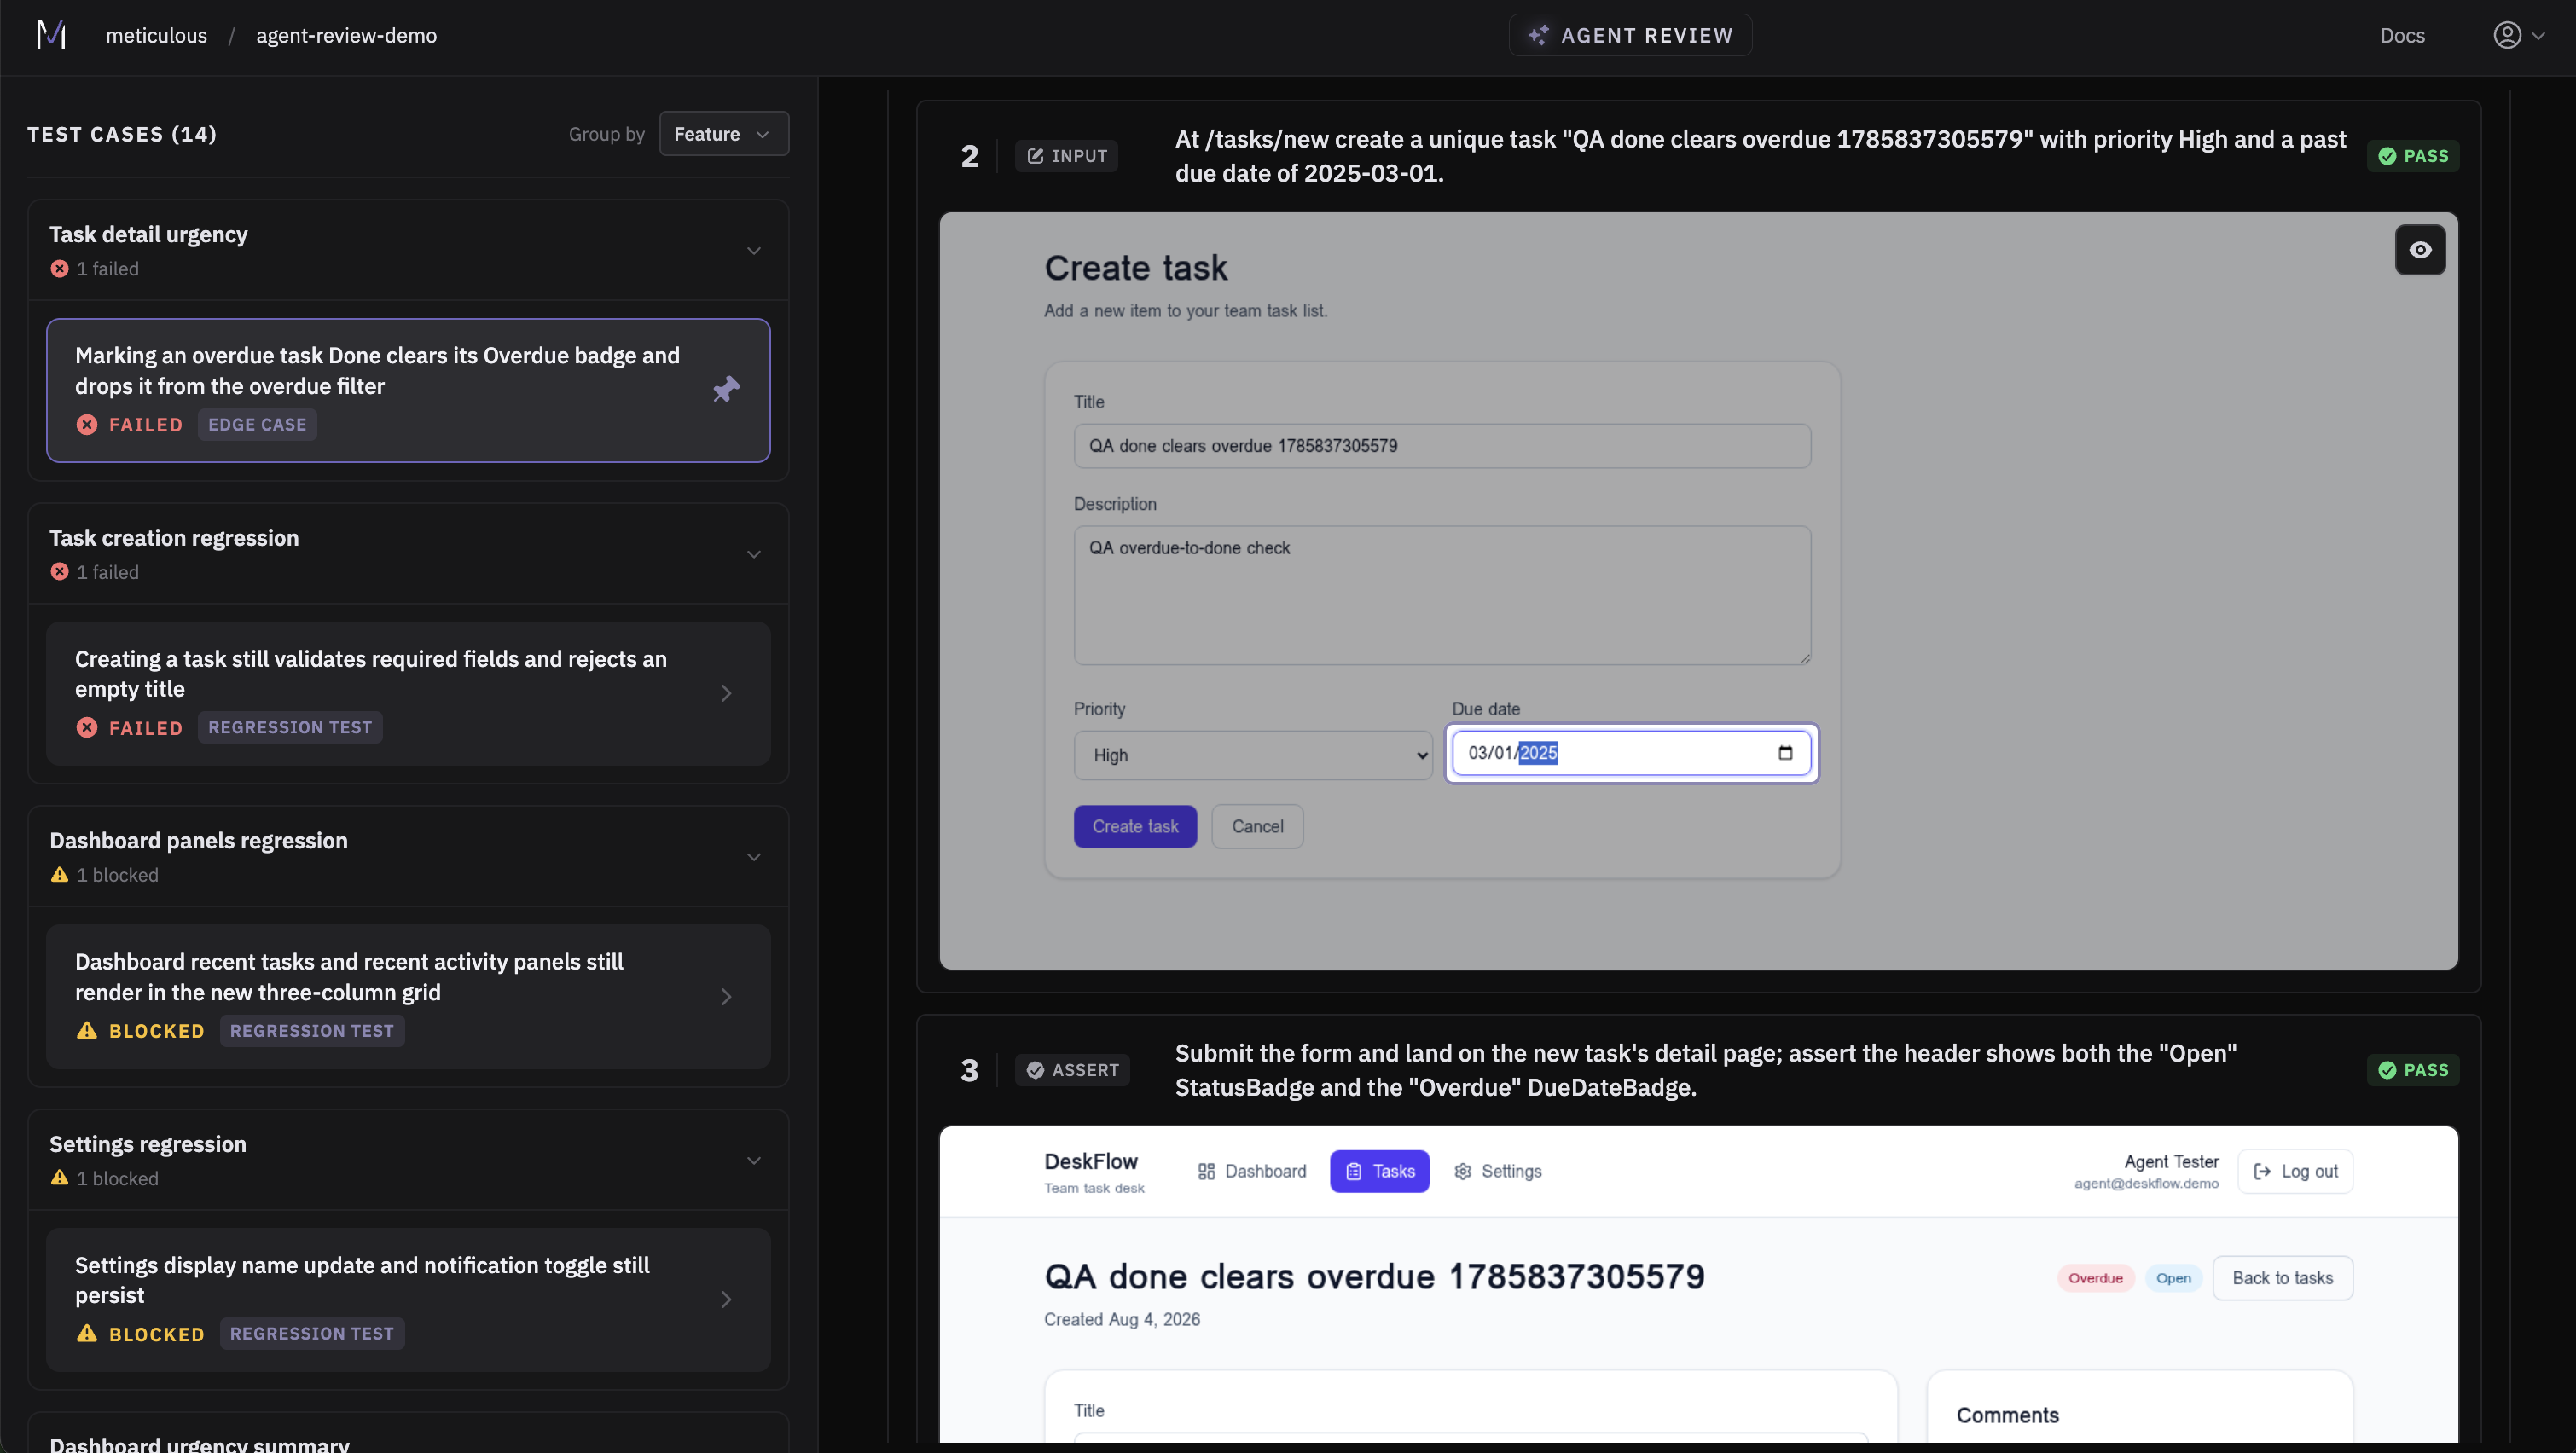
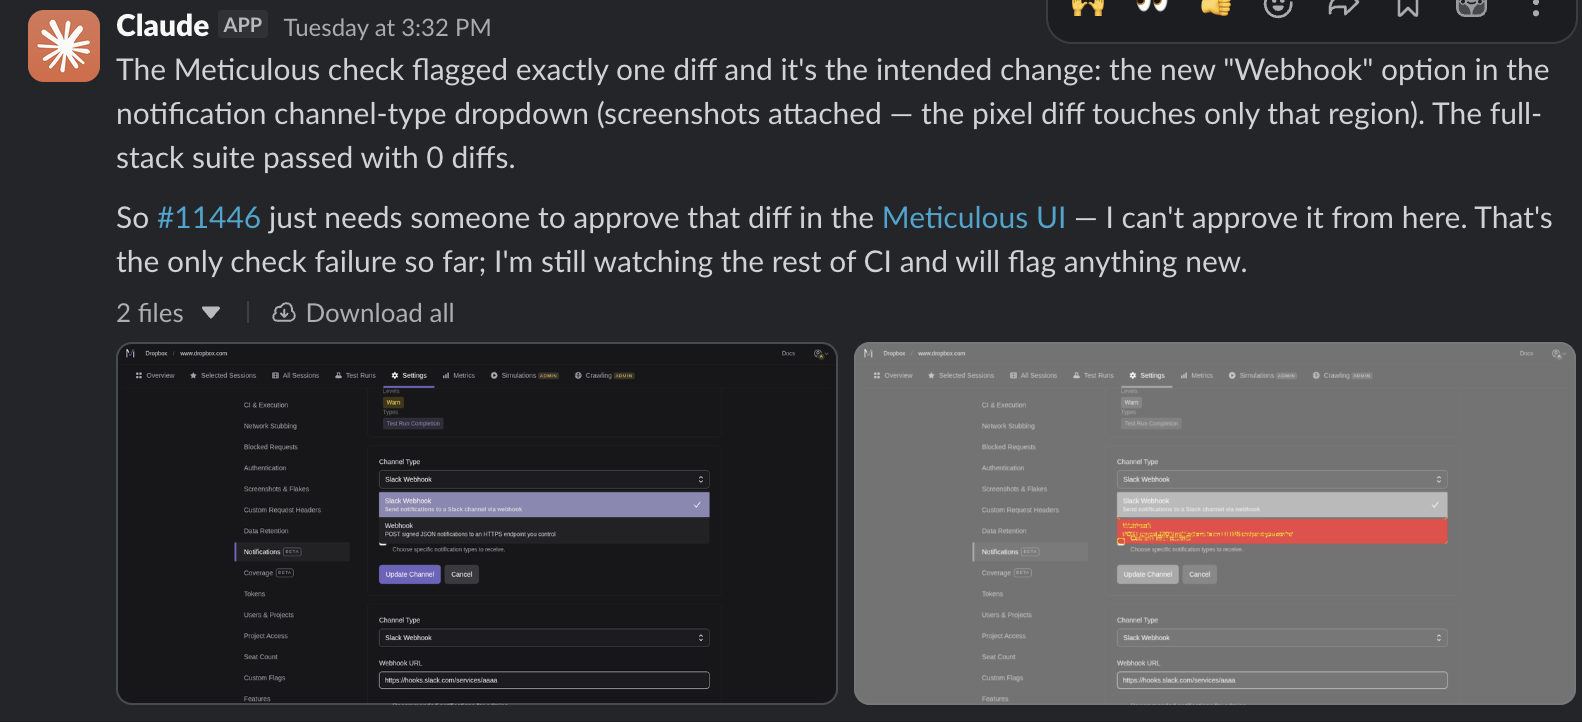
Claude, migrate all 1000 class components to hooks. Use Meticulous to test this PR locally: if you see visual diffs, fix and re-run till you eliminate all unexpected diffs. Don't change any components Meticulous doesn't have 100% coverage for.
Claude, review the Meticulous test for the current commit, fix any issues.

Meticulous has thousands of sessions recorded, each mapped to the lines of code in your codebase, and covering real user journeys, network mocks and data edge cases.

Meticulous skills let your agent leverage this: either by pulling the results of a Meticulous test run, or by proactively finding the relevant sessions impacted by the local changes and running them against them. Get started here.

We're actively expanding these skills. If you've got a workflow you wish you could hand to an agent but can't, let us know!

πŸ“Š Detect FE Performance Regressions & Custom Checks (Beta)

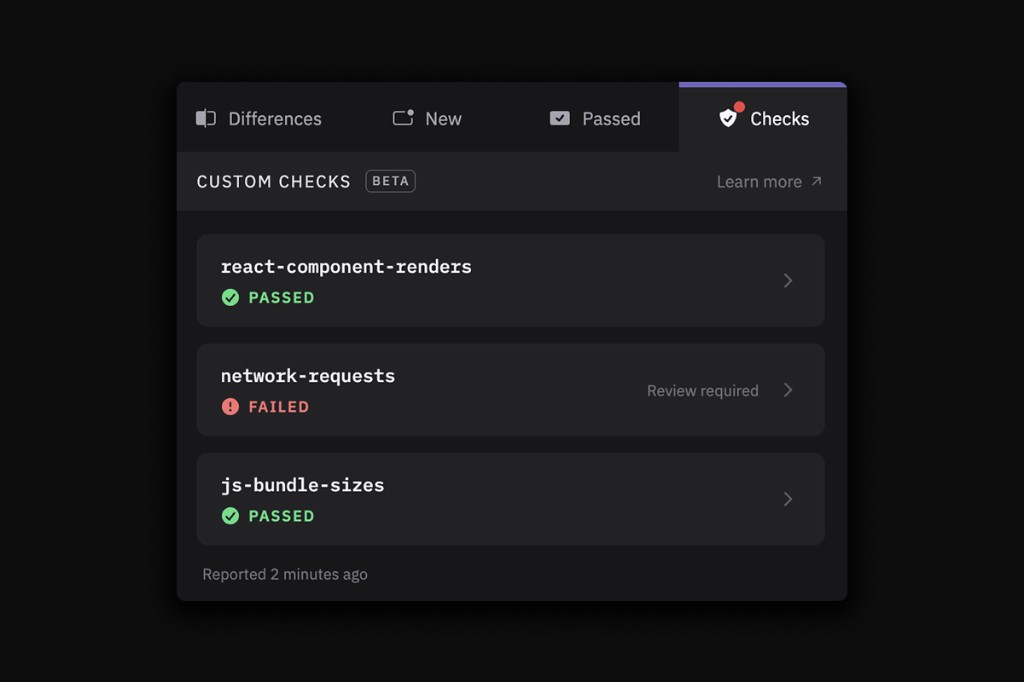
Screenshot of custom checks results including a passed react component renders, a failed network requests and passed javascript bundle size check

Meticulous simulates most code paths and edge cases in your application on every change. Custom checks let you piggyback on this to detect regressions in anything you can measure.

We have checks that flag if a PR significantly increases:

  • React-component re-renders
  • Number of network requests made
  • Bytes of JS code loaded across many flows
  • JS statement execution count (deterministic proxy of CPU time)

You can also write your own checks – covering anything from performance to accessibility. Meticulous's deterministic browser can help reduce noise in many performance measures. Let us know if you'd like early access.

πŸ’¬ Comment on Diffs (Beta)

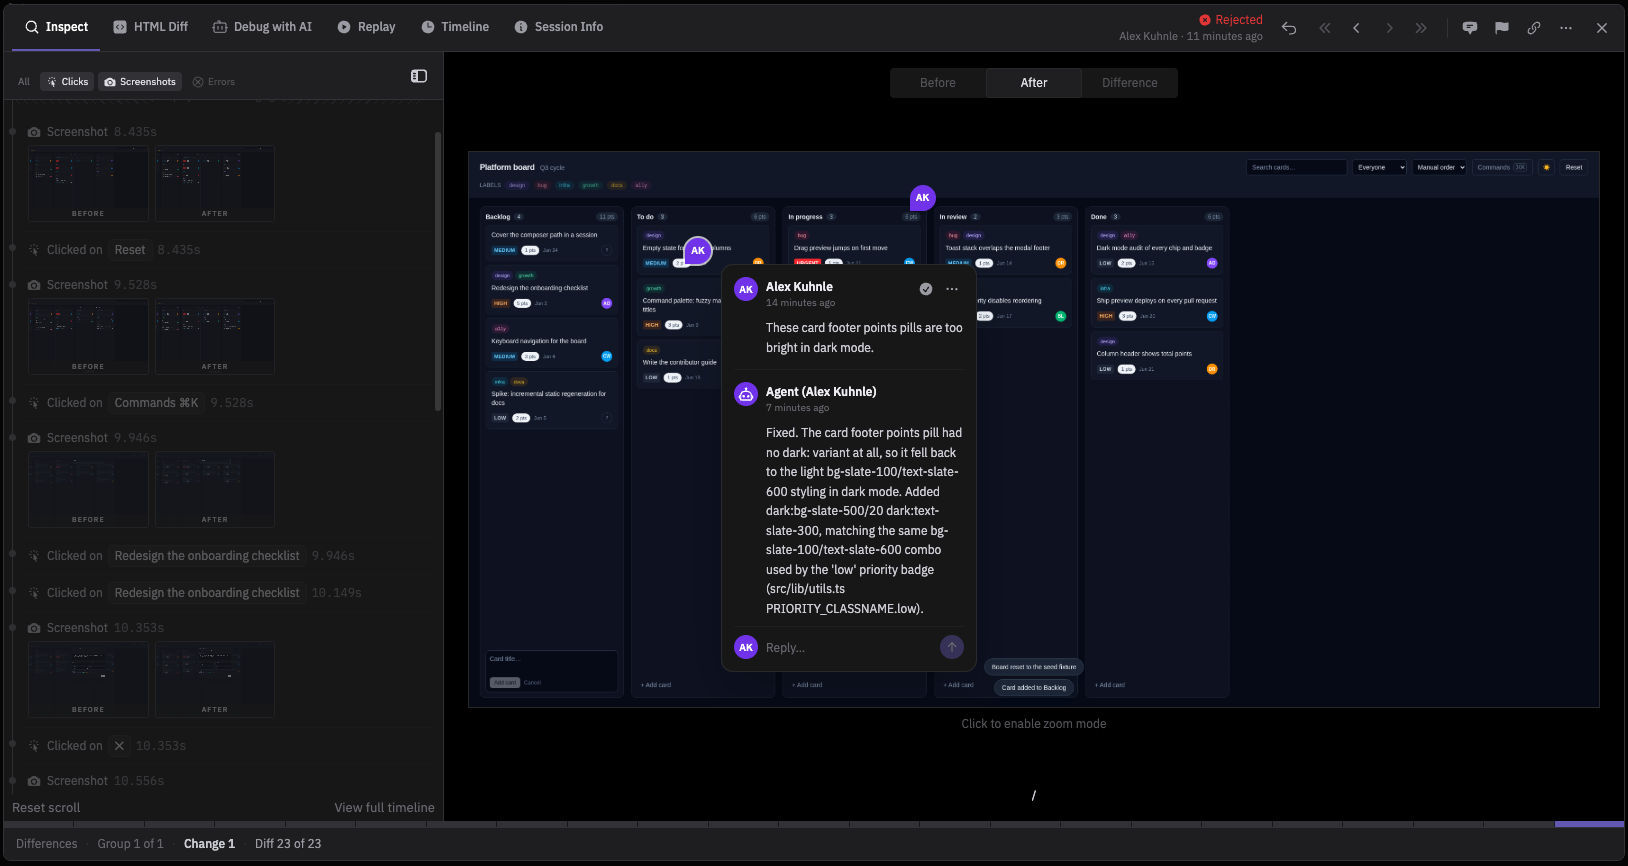
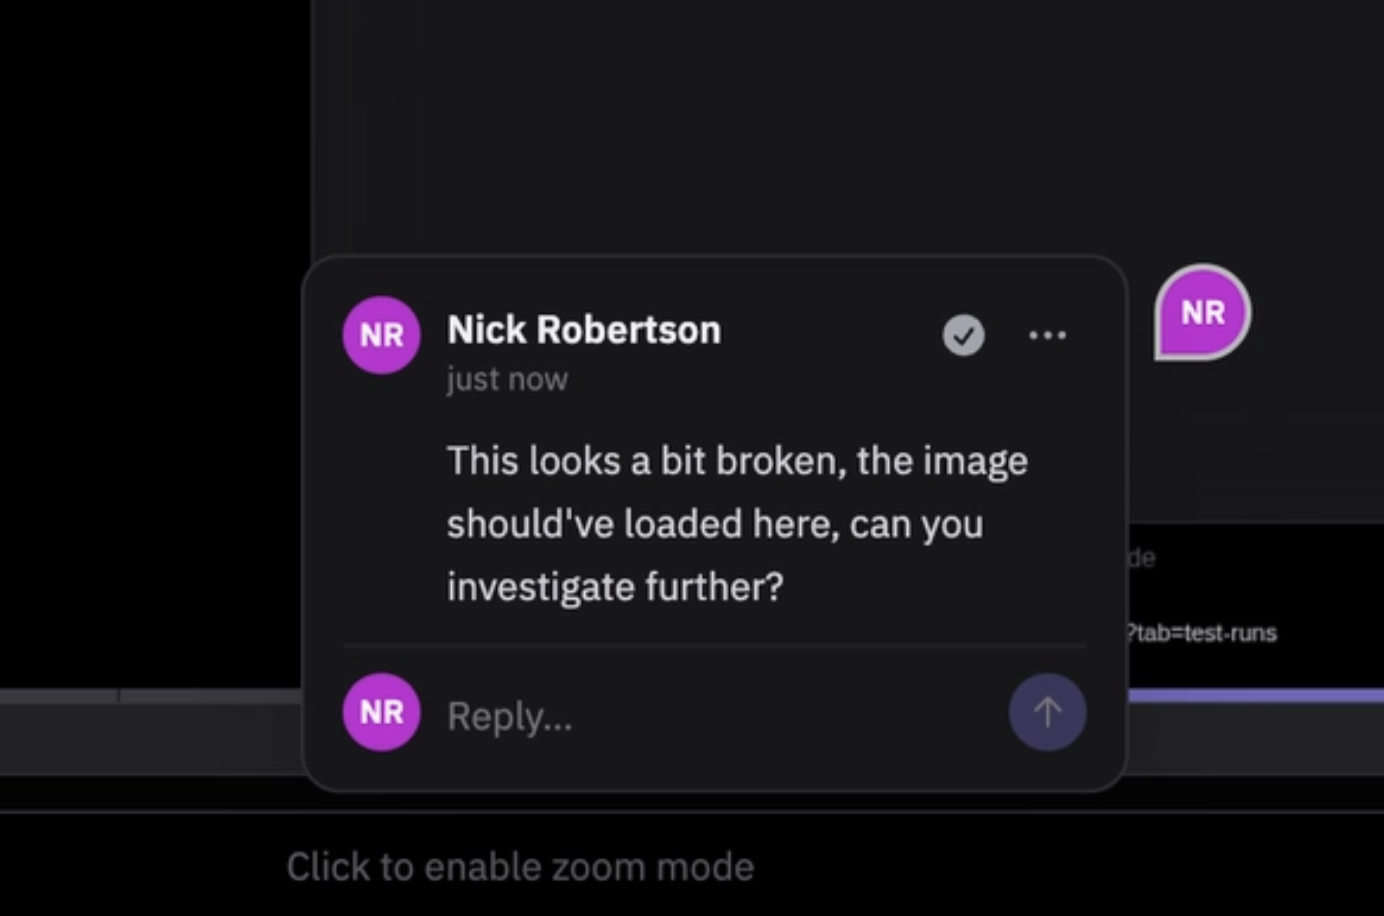
Screenshot of comment on a difference flagging a potential issue

Reviewing as a team usually means screenshotting a diff, pasting it into Slack, and writing "wait, is this expected?" We're fixing that. You're now able to drop a comment on a diff and have the conversation right inside Meticulous, where all the context already lives. This is rolling out in beta shortly, give us a shout if you want early access.

πŸ”™πŸ”š Backend Record & Replay

Meticulous has always been brilliant at detecting frontend changes. Now we're going down the stack.

We've started recording and replaying what your server does, eg. Postgres queries and outbound HTTP calls, and surfacing backend spans right in the network tab alongside frontend requests. If you run a server-side-rendered app and you've ever wanted Meticulous to see the whole picture, this is for you.

...and more

  • πŸ”Œ WebSocket traffic in the network panel – The session network panel now logs WebSocket messages, not just HTTP requests, so realtime apps are far easier to debug.
  • βš™οΈ Web Worker replay – Apps that offload work to Web Workers now replay faithfully instead of going quiet.
  • πŸͺŸ Same-origin iframes in screenshots – We now inline same-origin iframe DOM into the screenshot, so embedded content actually shows up in your diffs.
  • πŸ†• Onboarding Explanation – improved experience for new joiners with more educational content on how to use Meticulous in the UI.

Debug with AI from the test run, richer session debugging, and manual recording

Debug with AI now runs from the test run page, new context and network tabs for session debugging, manual session recording, and more.

πŸ€– Debug with AI from your Test Run

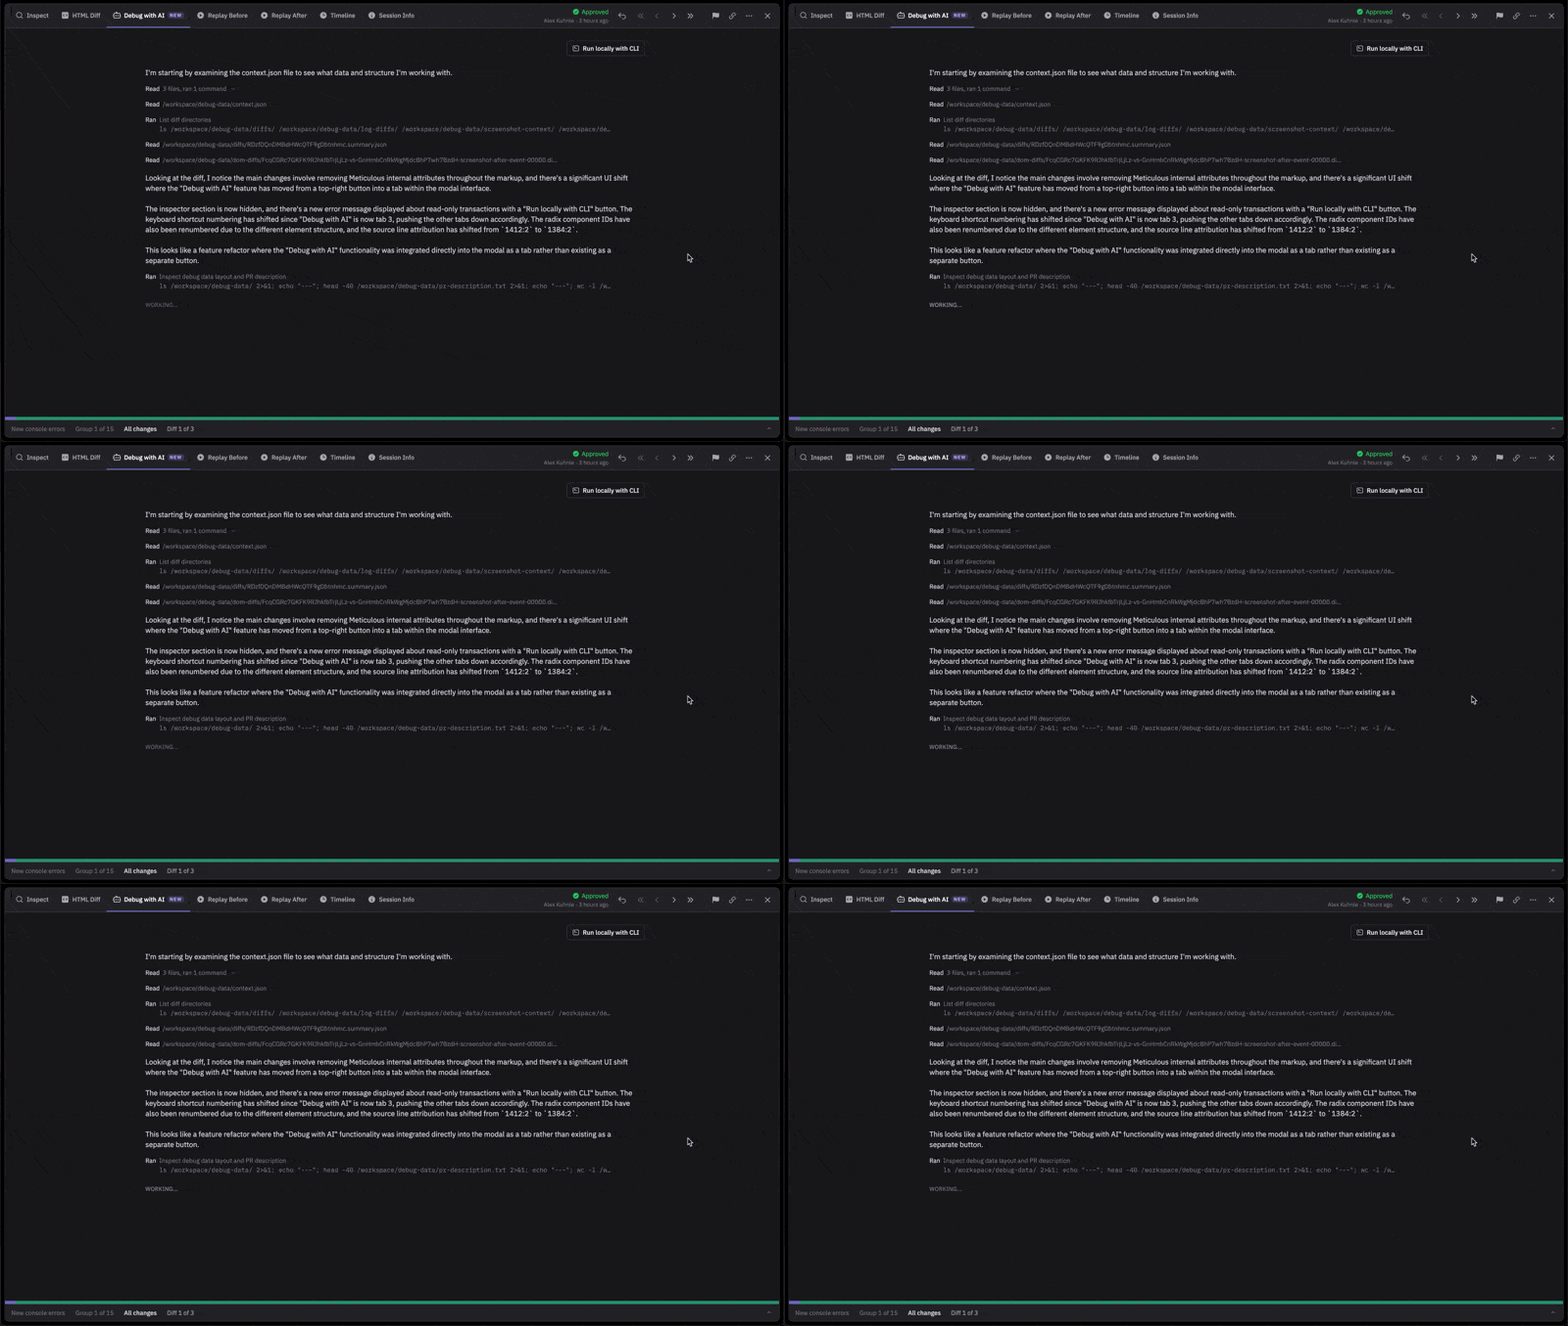
When you use Debug with AI, you get a full diagnosis of the difference. We rebuilt it so you can run it directly from the test run page. It now lives as a tab in the modal after you click into a diff. The agent reads in context from your PR and the Meticulous replay so it knows what code changed as well as all the events leading up to the diff.

Debug with AI

πŸ”¬ Improved Session Debugging

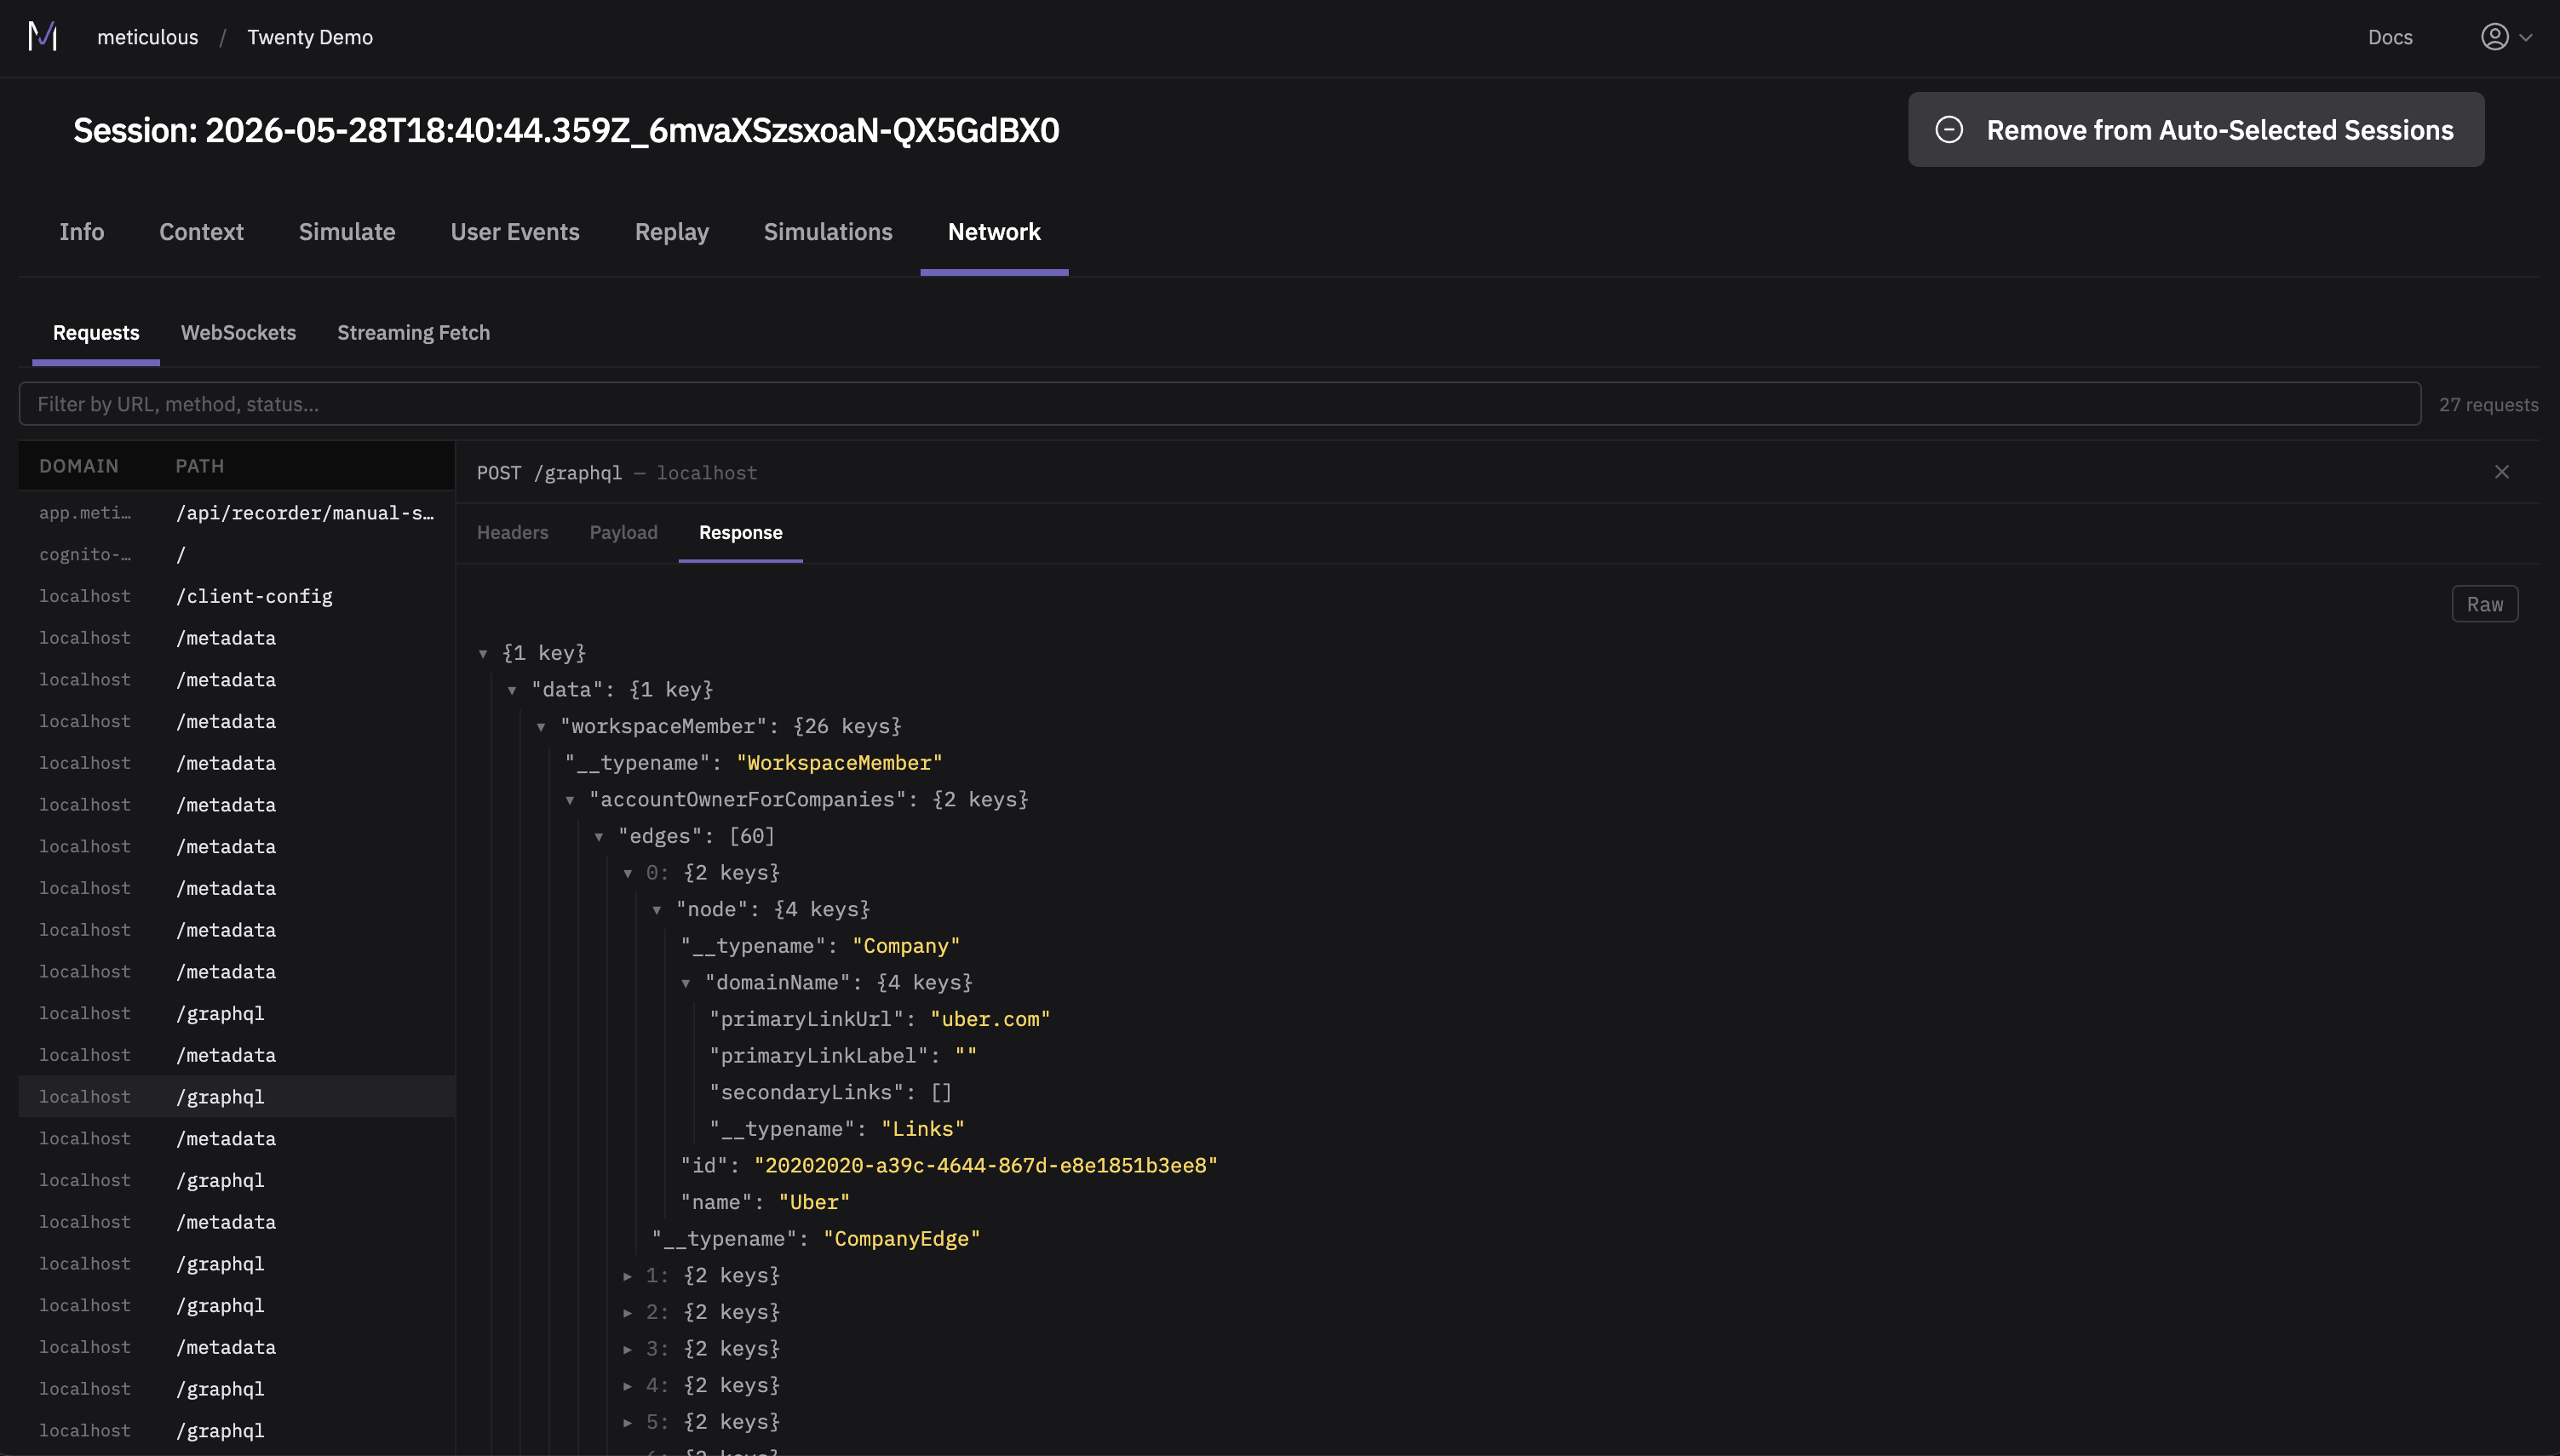
We've added new tabs to the session recording page, making it easier to debug the recorder on new projects. The context tab shows you the user identity, session context, and what feature flags were active during that session. The network tab gives you a full log of every HTTP request, WebSocket message, and streaming fetch from that recording.

Full network inspector for sessions

πŸŽ₯ Manual Session Recording

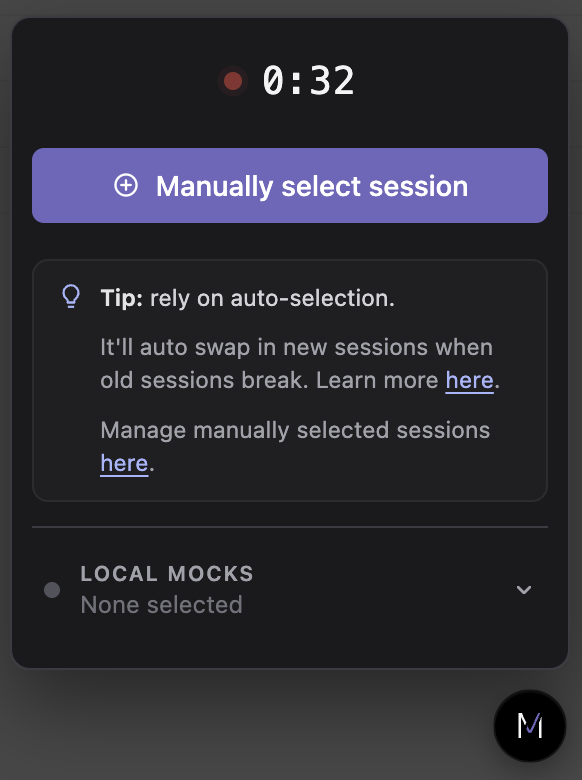
We have made it simpler to explicitly record a session for Meticulous rather than relying on background recordings. You can now see the length of the current recorded session and pin and label it directly from your frontend. Read more on how to get started.

New Session Recorder

...and more

  • πŸ“Ί Live test run statuses auto-update – The test runs overview page now updates in real time; no more manually refreshing to see if your run finished.
  • ⏩ Timeline jumps to the right screenshot – Opening the Timeline tab now scrolls straight to the screenshot you're looking at instead of dropping you at the top. The selected event is also saved in the URL, so when you share a link, whoever opens it lands right on the event you were inspecting.
  • πŸ•΅οΈ User event timeline upgrade – Side-by-side details panel, screenshot previews, and a real DOM path-diff on each event so you can see exactly what changed in the tree, not just that something changed.
  • 🦾 Agent CLI – We love how you have been weaving Meticulous into your agentic setups. You can now log in directly via OAuth in the CLI rather than having to rely on an API token. Check out our docs to get started with agents in Meticulous.

Diff Detail View, faster test runs, and performance testing

A focused diff detail view, faster test runs across the board, performance testing in beta, and more.

πŸ” Diff Detail View

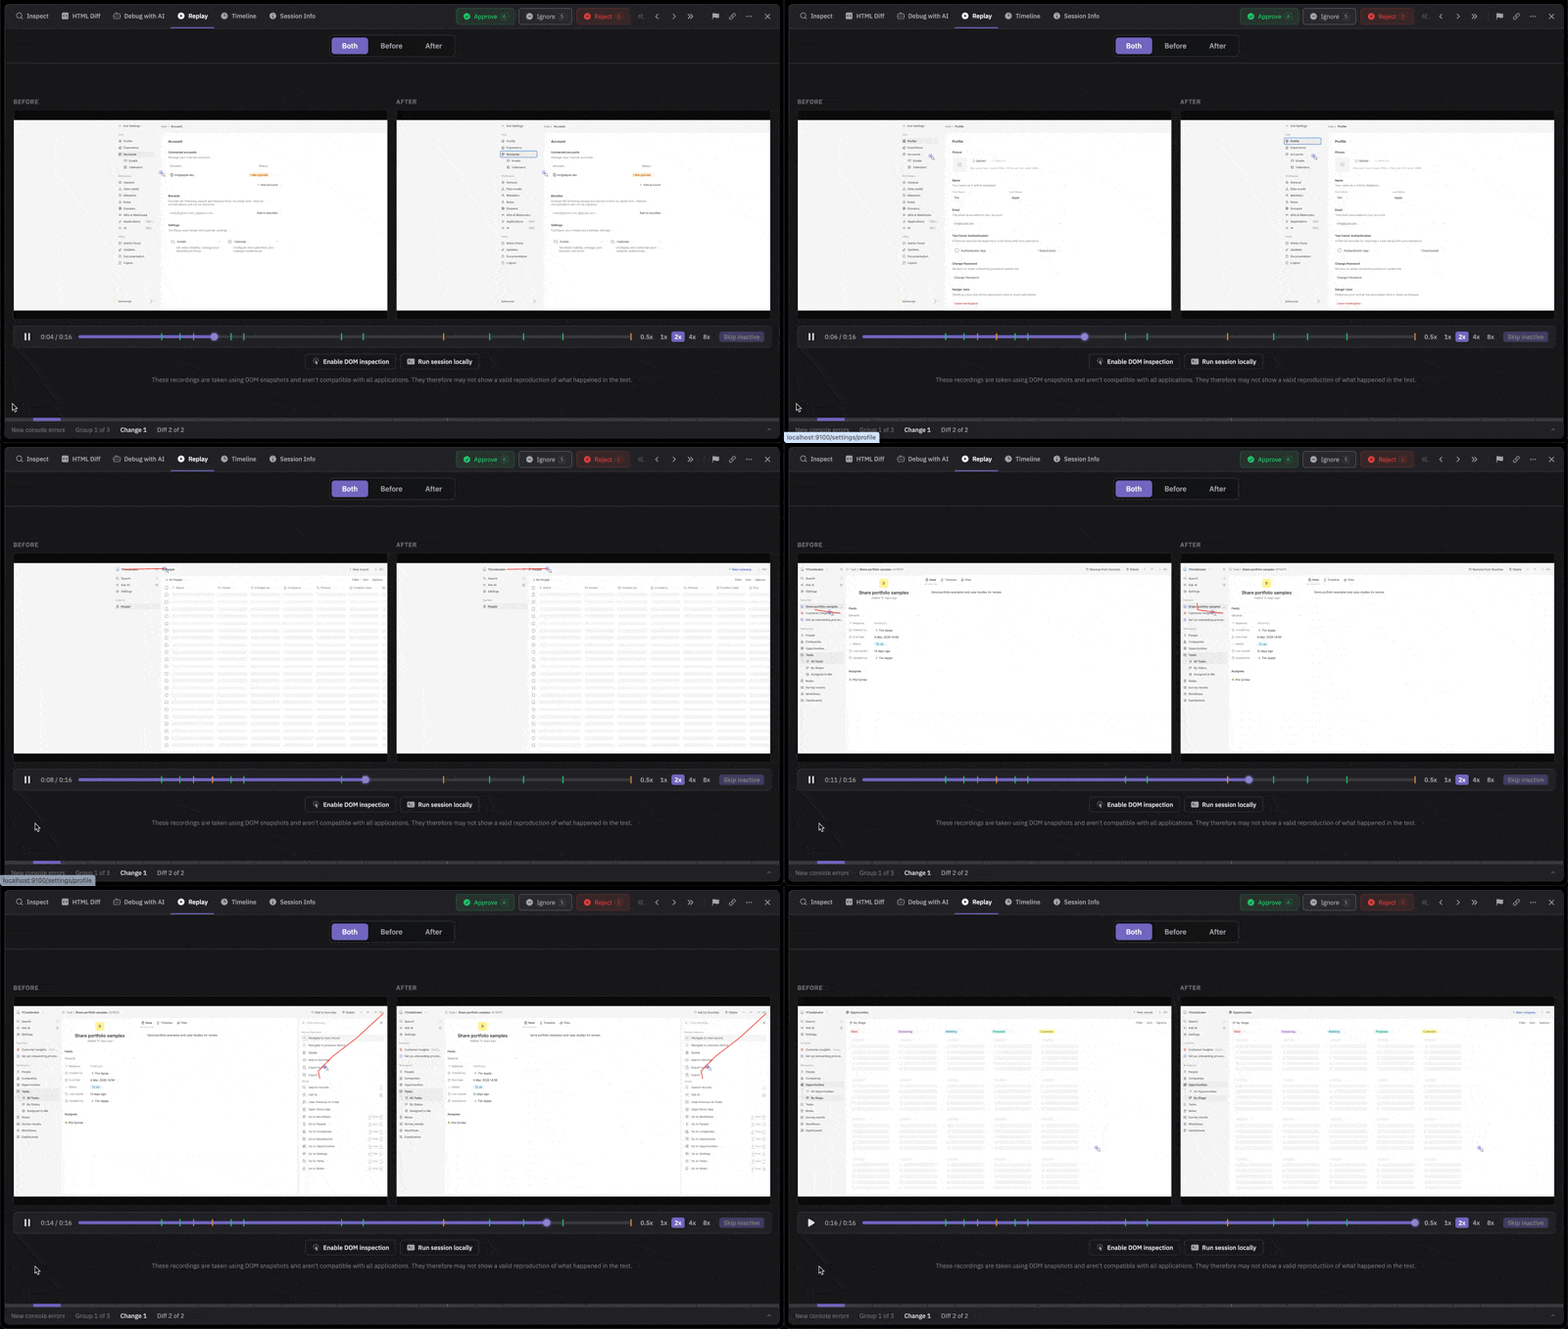
When looking at the before and after screenshots has you scratching your head, click on a diff to open up the new focused full-screen modal. You can see everything that happened leading up to that diff, and rapid access to all our more advanced debugging tools such as HTML DOM snapshots, replays, etc.

Demo of the new diff detail view

⚑ Faster Test Runs

We've spent a lot of April making test runs quicker. A few of the bigger pieces:

  • Parallel base & head execution – head replays no longer wait for the base run to finish. You'll notice this even more on stacked PRs
  • Session slicing – a single long session used to slow down how quickly we could share test run results. They're now sliced into shorter, replayable chunks, which gets more of your real user flows into every test run without dragging runtime up
  • Faster startup – replay workers have been rearchitected so less time is spent waiting for your test run to start executing
  • Faster uploads – S3 transfer acceleration is on for recorder, asset, and container uploads
  • More resilient runs – one bad chunk no longer fails the whole test run; we will automatically retry
Meticulous engineer working on test run acceleration strategies

πŸ“Š Performance Testing (Beta)

Visual diffs are great, but "did this PR make the app slower?" is a question we keep hearing. Replays now capture real performance signals - memory usage, CPU pressure, TTI and more. Pair that with hardware-pinned benchmarking (so you're comparing apples to apples across instance generations) and you can start spotting perf regressions on the same PR-by-PR cadence as visual ones.

This is early and we're looking for design partners to shape it. If perf regressions are a thing your team cares about, let us know and we'll get you set up.

βš›οΈ React component names in DOM snapshots

The HTML diff viewer now surfaces React component names (resolved through your source maps), so you can tell what component you're looking at without playing detective.

React component names in HTML diff viewer

...and more

  • πŸ”€ Session extension (Beta) – adds coverage to your project by intelligently mutating session data from network traffic, feature flags, etc. to hit uncovered paths. Let us know if you'd like us to enable this feature for your project.
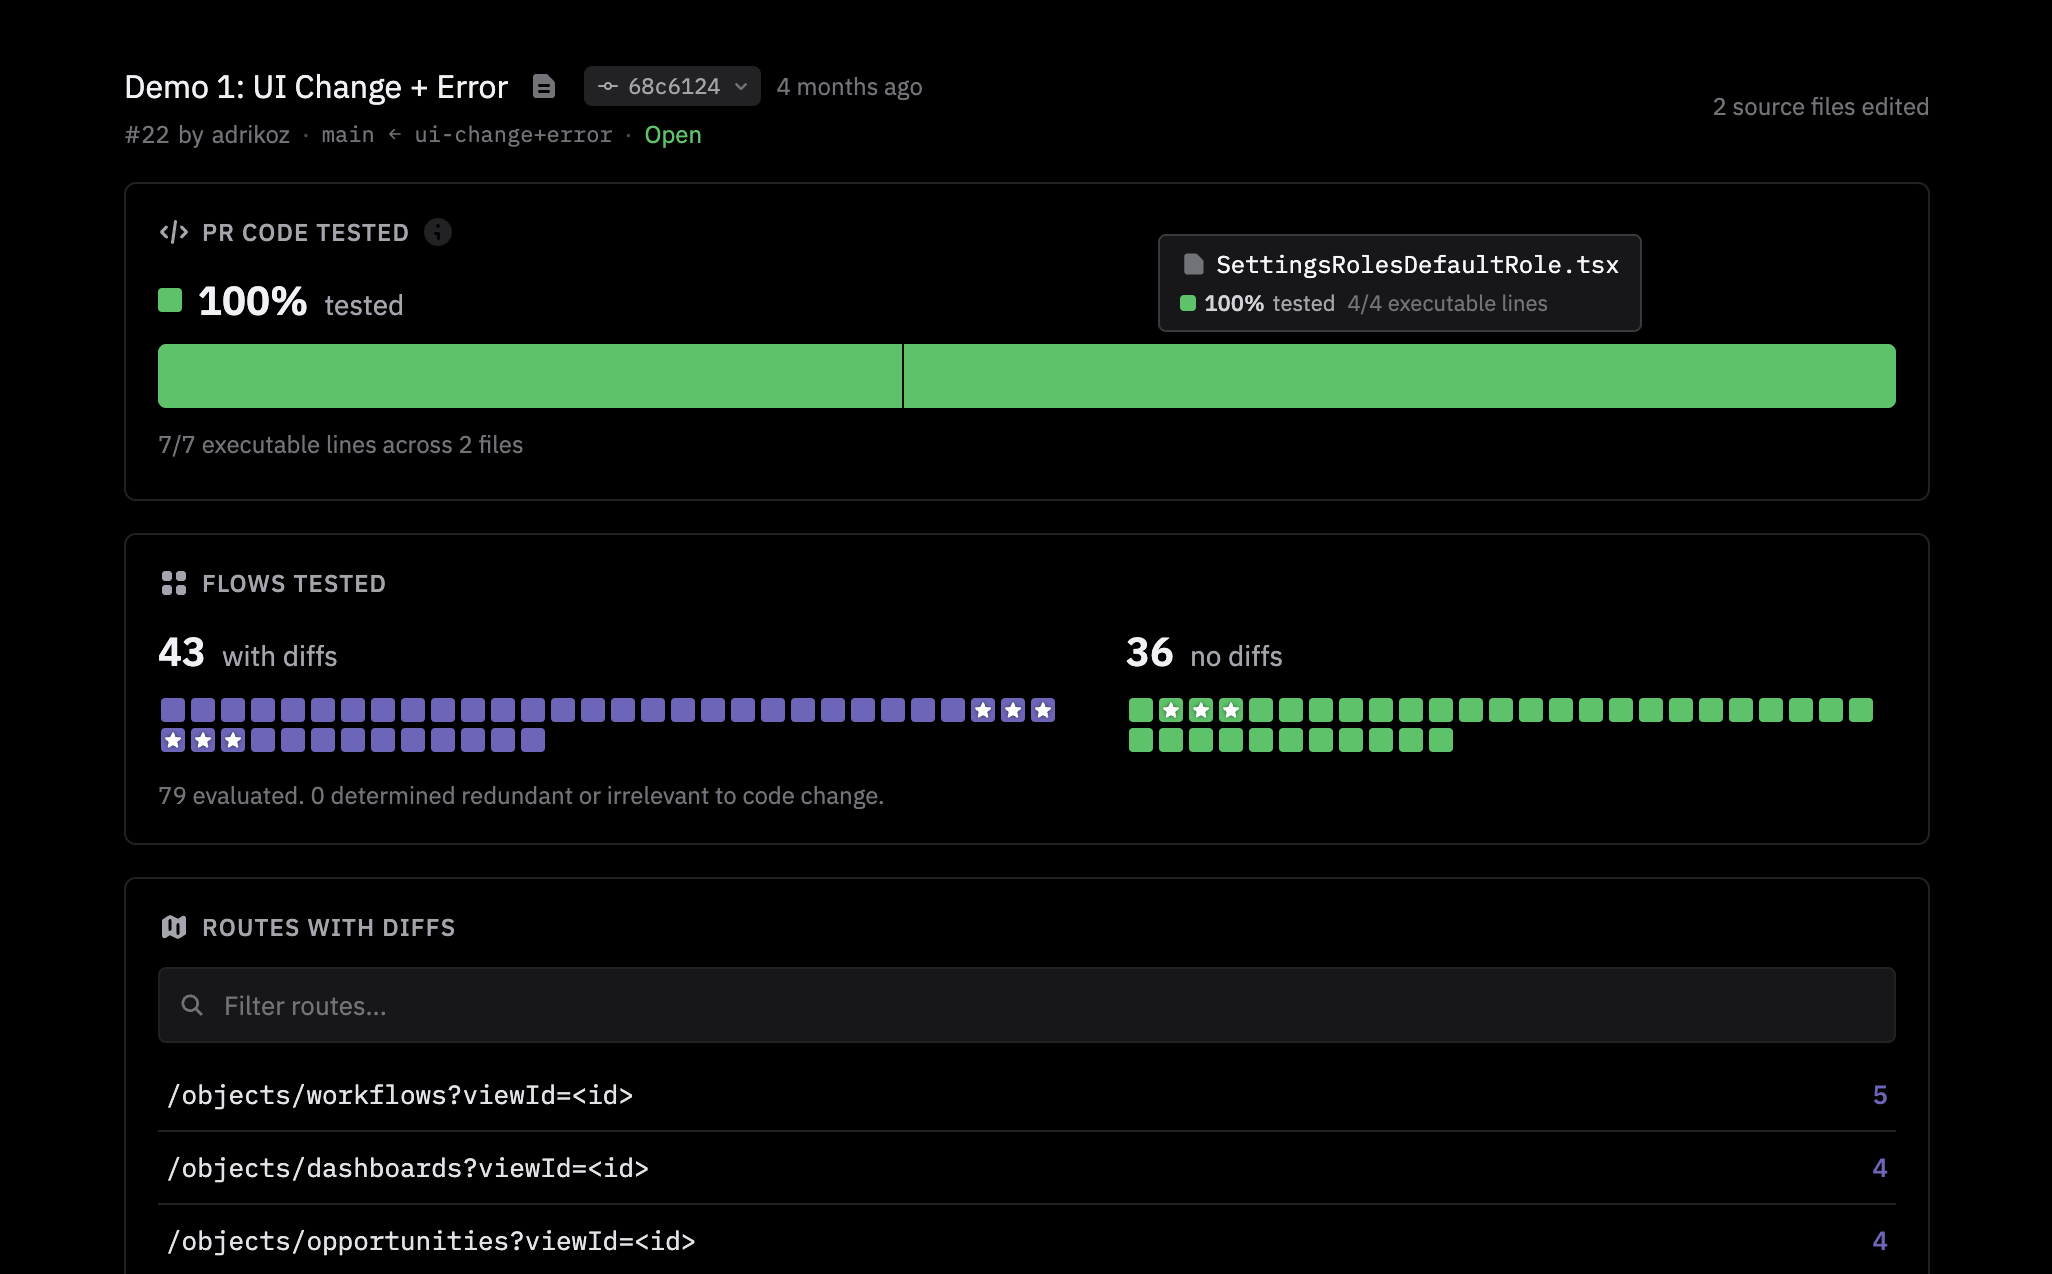
  • βœ… Describe Tested rolls out to everyone – The PR coverage callout that tells you whether Meticulous actually exercised the code your PR touched is now on for all projects, thank you to everyone who used the beta feature!
  • πŸͺͺ Reader role + project-scoped SSO claims – New read-only role and meticulous_role / meticulous_projects SSO token claims so you can give people access to specific projects without handing over the whole org.
  • πŸ“‹ Copy as prompt – One-click copy of a diff (with screenshot URLs and React component-source metadata) as an LLM-ready prompt - paste into your Claude Code to give it context on what you want to fix.
  • 🧰 Broader recorder coverage – Better fidelity for Rive animations, navigator.locks, SubtleCrypto.digest, PressureObserver, ReportingObserver, tRPC batched/streaming requests and batched GraphQL.
  • πŸ—ΊοΈ Unminified Stack Traces – Error reports in your application now display exactly where in the application they occurred, not just that they occurred!
  • πŸ€– Agentic Skills – we're continuing to iterate on our agentic skills library. Let your agent execute Meticulous against its local changes and iterate on the results, e.g. "Upgrade React major version and then use Meticulous to iterate until you remove all unexpected visual differences".

Metrics dashboard, inspect panel redesign, and Debug with AI

A new metrics dashboard, a redesigned inspect panel, Debug with AI in the UI, and more.

πŸ“Š Metrics Dashboard

We've built a new dashboard that gives you a bird's-eye view of how Meticulous is performing across your project: track code coverage trends, test run execution time, user engagement and potential bugs that Meticulous has flagged. You can access it from your Meticulous project page.

Metrics Dashboard

πŸ” Inspect Panel Redesign

We've rebuilt the timeline sidebar to make the events leading up to a diff much more intuitive, so you're not scrolling through 47 duplicate rows wondering what went wrong in this test run or your life. This is just the beginning of our planned design work to better surface relevant context around each visual difference, so let us know what is and isn't working for you.

New inspect panel

πŸ€– AI. AI Everywhere!

When a test failure has you scratching your head, and even the newly redesigned inspect panel cannot save you, there is now a "Debug with AI" button right in the Meticulous UI. It sets up an AI-assisted debugging workspace, so you can investigate what went wrong without having to piece together CLI commands. Think of it as pair-debugging with someone who already has all the context loaded. If you'd rather give agents direct access to your Meticulous test runs through the CLI, we recommend adding these new skills. We're going deep on agentic workflows - if you have thoughts on what would be most useful, we're all ears.

Debug with AI Popover

...and more

  • πŸ”— Combined PR Comments – If you have multiple Meticulous projects in one repo, results now appear in a single PR comment instead of cluttering your PR thread.
  • πŸ§ͺ Smarter Network Patching – Several improvements to how we match and repair API responses, meaning fewer false diffs caused by stale mocks.
  • βš™οΈ Self-Serve Network Settings – Request and response size limits (and other settings that used to require contacting us) are now available in your project settings.
  • 🧡 Test Runs Threaded by PR – The project test runs page now groups runs by pull request, so older runs collapse under the latest instead of filling your screen.
  • πŸ’¨ Session Acceleration – We're actively working on making Meticulous test runs faster.

App container uploads and a redesigned test run default view

Upload your app as a Docker container for test replays, a redesigned test run landing page, and more.

πŸ“¦ App Container Uploads

Meticulous now runs reliably against complex server-side rendered apps and custom build pipelines, without preview URLs or the tunnel. You can now upload your app as a Docker container for Meticulous to run test replays against. This gives teams a more reliable, faster, and cheaper way to run Meticulous. You should only switch if you're not using the static asset upload method. See docs for more info.

πŸ§ͺ Test Run Default View Improvements

We've redesigned the content on the test run landing page to provide more helpful information including: sessions run, approvals, an updated "how to review" section, and keyboard shortcuts for our power users.

Test Run Default View

...and more

  • πŸ–ΌοΈ Iframe Network Recording – Network requests inside iframes are now captured, improving coverage for apps with embedded content.
  • 🌈 Timeline Tab Improvements – Better colour scannability and filtering in the replay timeline view.
  • πŸ” Improved Divergence Details – Redesigned divergence information UI with clearer context on what changed and why, making it easier to understand diffs at a glance.
  • πŸ”— Stable Diff Links – We've updated our selected difference URL format to make sharing differences with other users smoother.
  • ⚑ Faster Session Repair – Core engineering work that significantly improves the speed of network patching.
  • πŸ” OAuth JWT Authentication – Added OAuth JWT to make Meticulous CLI commands easier to access.