

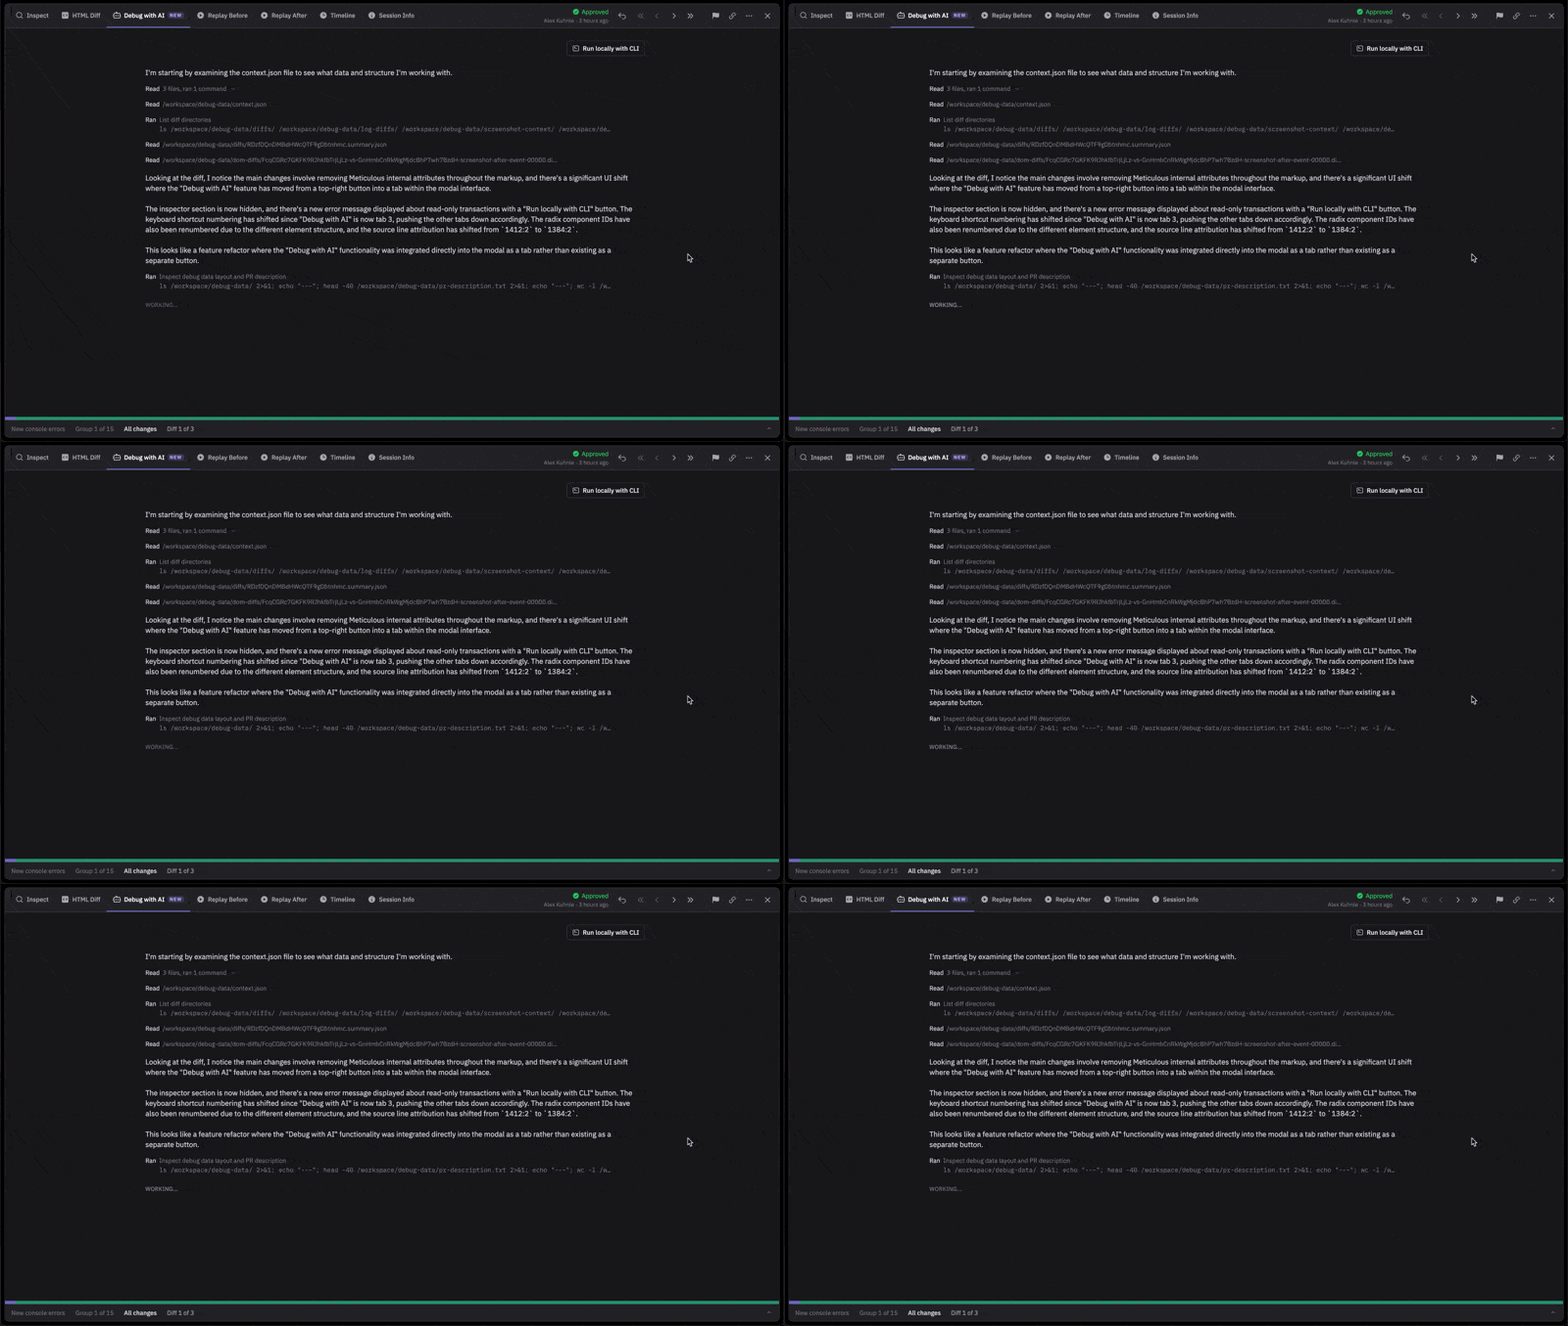
When you use Debug with AI, you get a full diagnosis of the difference. We rebuilt it so you can run it directly from the test run page. It now lives as a tab in the modal after you click into a diff. The agent reads in context from your PR and the Meticulous replay so it knows what code changed as well as all the events leading up to the diff.
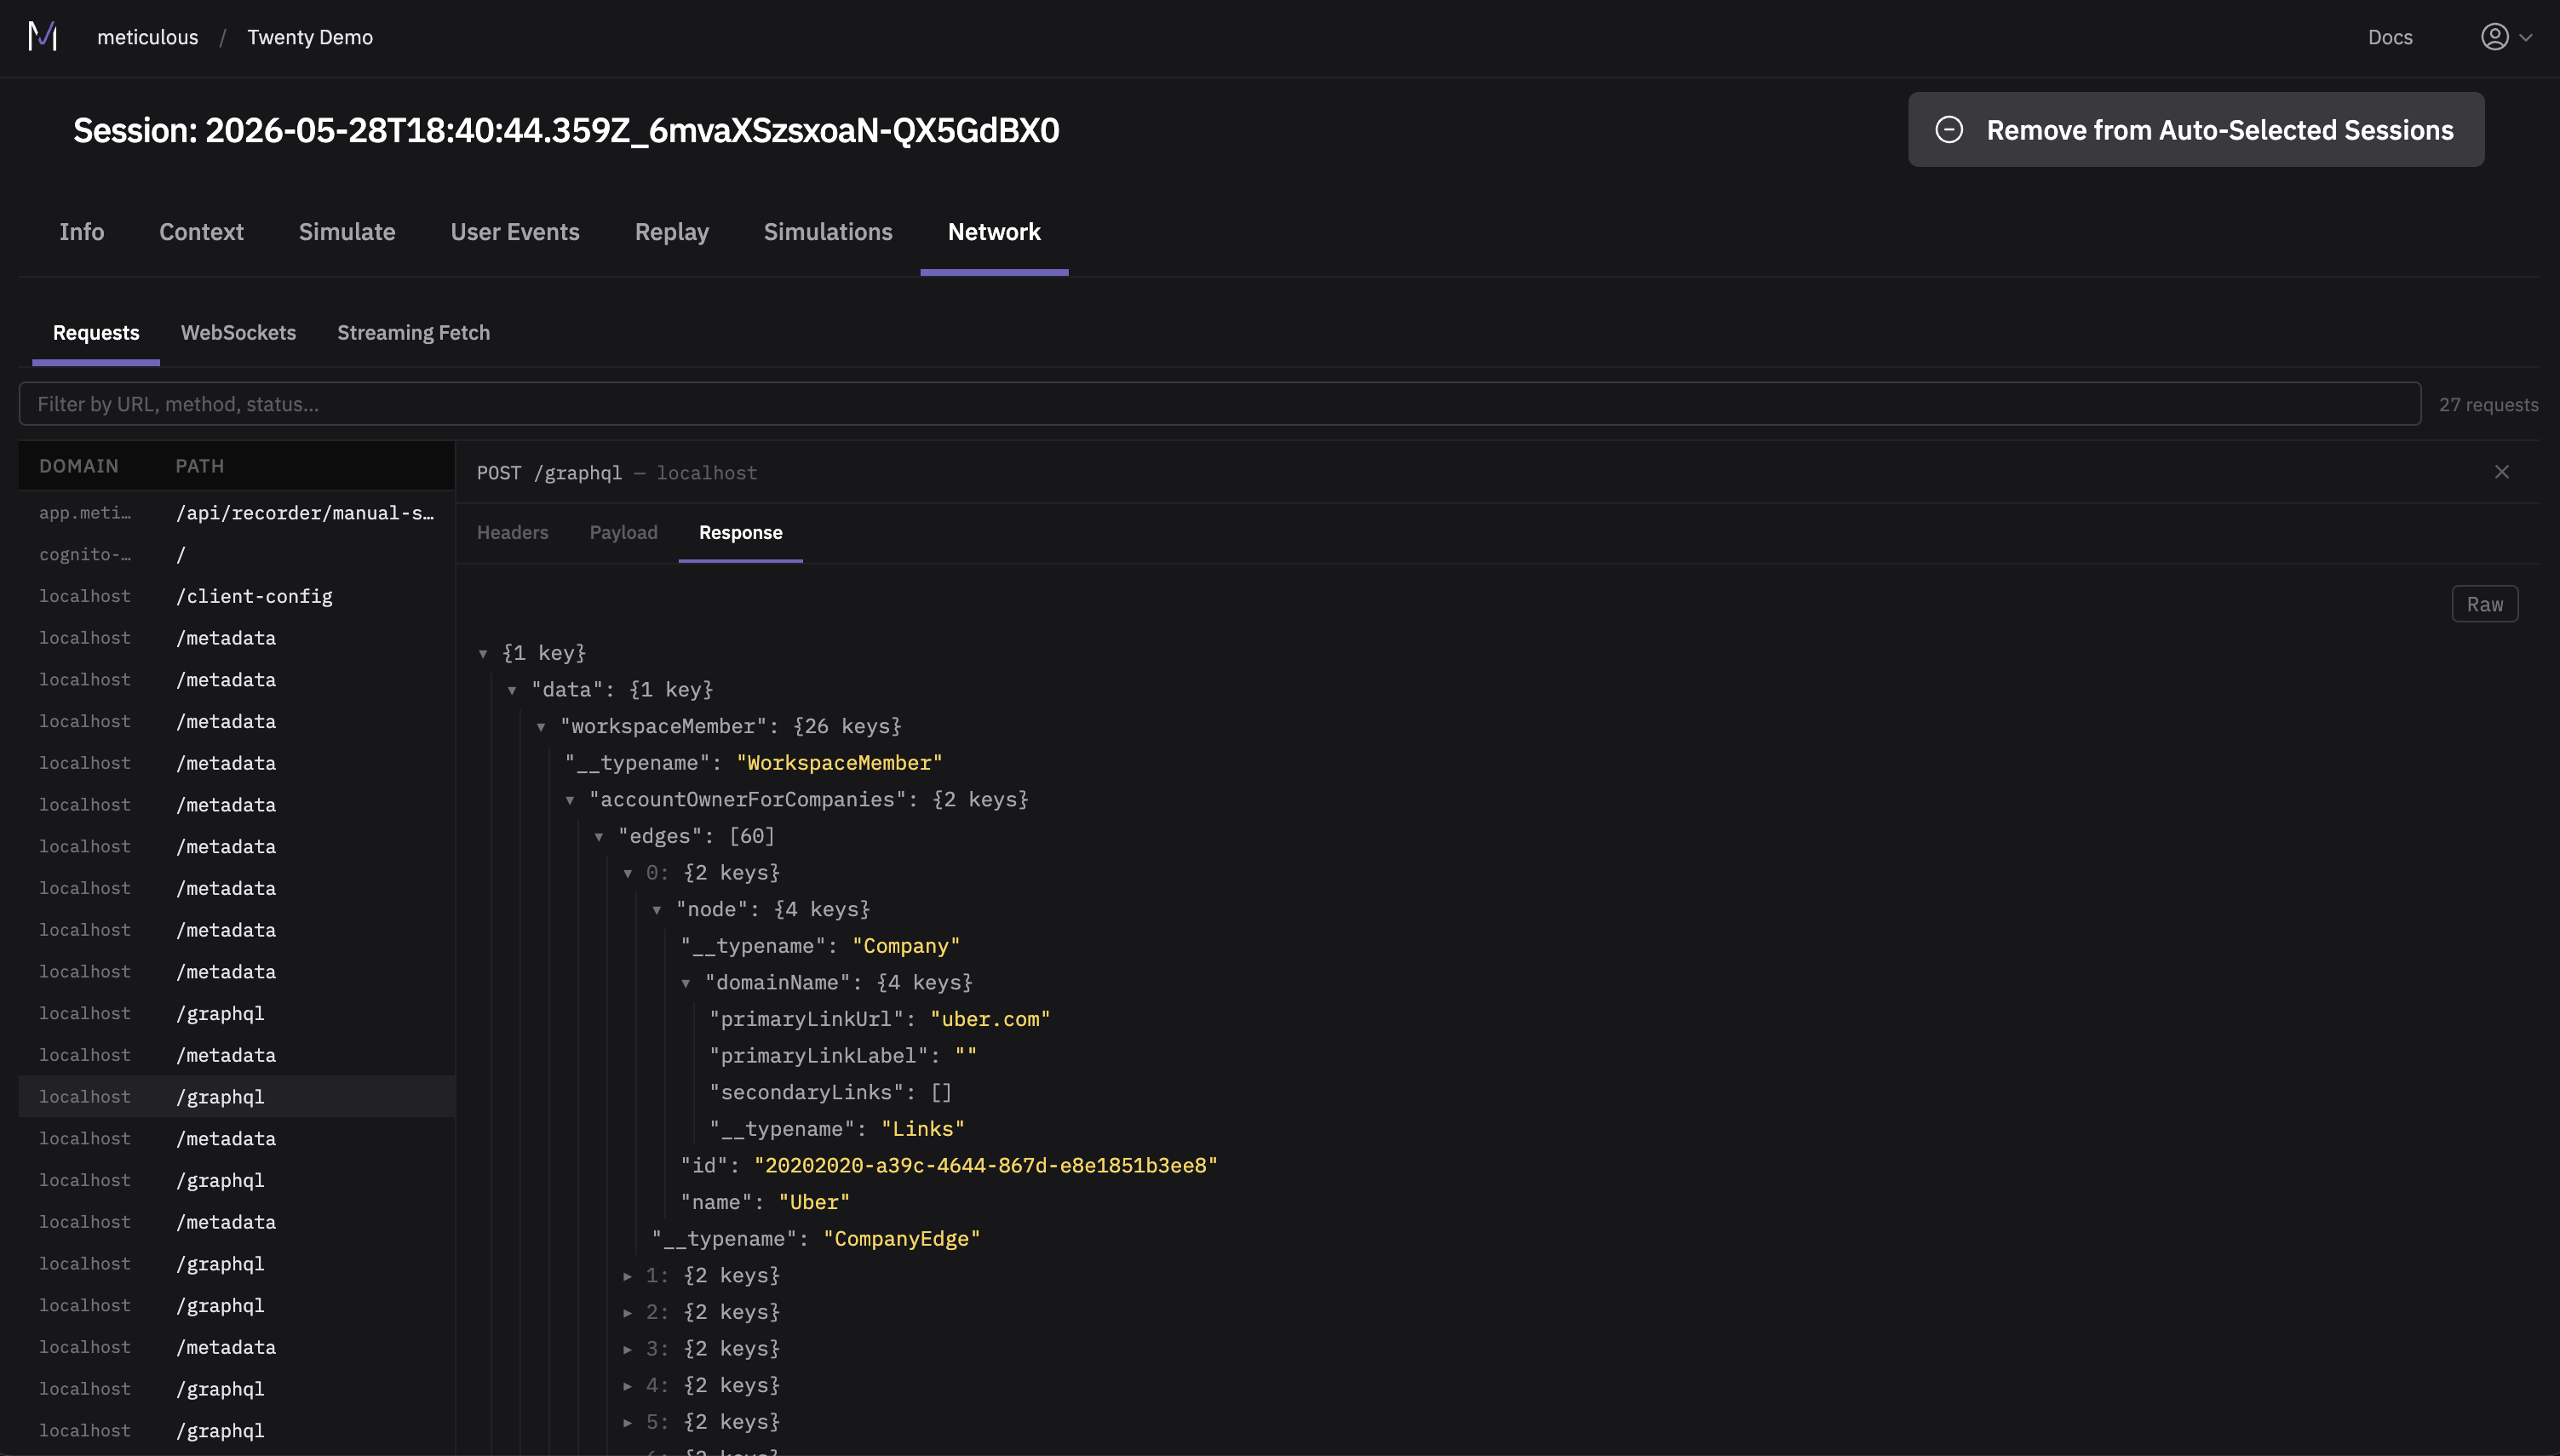
We've added new tabs to the session recording page, making it easier to debug the recorder on new projects. The context tab shows you the user identity, session context, and what feature flags were active during that session. The network tab gives you a full log of every HTTP request, WebSocket message, and streaming fetch from that recording.
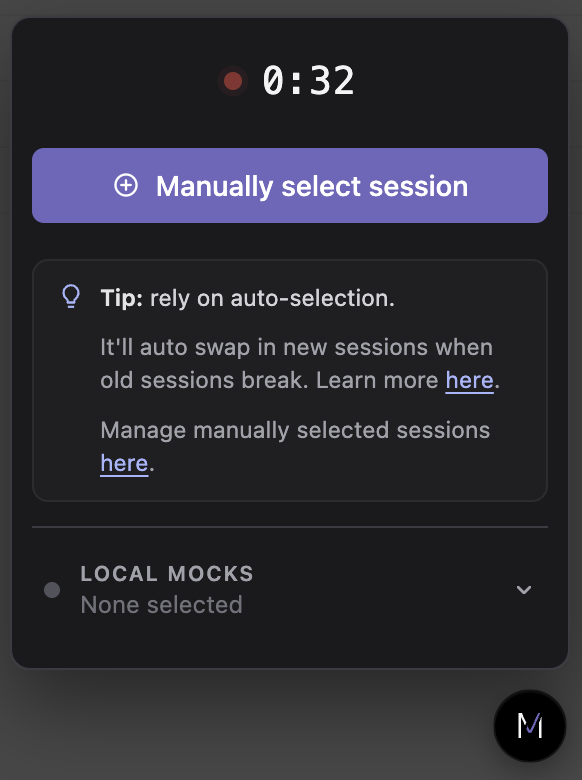
We have made it simpler to explicitly record a session for Meticulous rather than relying on background recordings. You can now see the length of the current recorded session and pin and label it directly from your frontend. Read more on how to get started.
- 📺 Live test run statuses auto-update – The test runs overview page now updates in real time; no more manually refreshing to see if your run finished.
- ⏩ Timeline jumps to the right screenshot – Opening the Timeline tab now scrolls straight to the screenshot you're looking at instead of dropping you at the top. The selected event is also saved in the URL, so when you share a link, whoever opens it lands right on the event you were inspecting.
- 🕵️ User event timeline upgrade – Side-by-side details panel, screenshot previews, and a real DOM path-diff on each event so you can see exactly what changed in the tree, not just that something changed.
- 🦾 Agent CLI – We love how you have been weaving Meticulous into your agentic setups. You can now log in directly via OAuth in the CLI rather than having to rely on an API token. Check out our docs to get started with agents in Meticulous.