

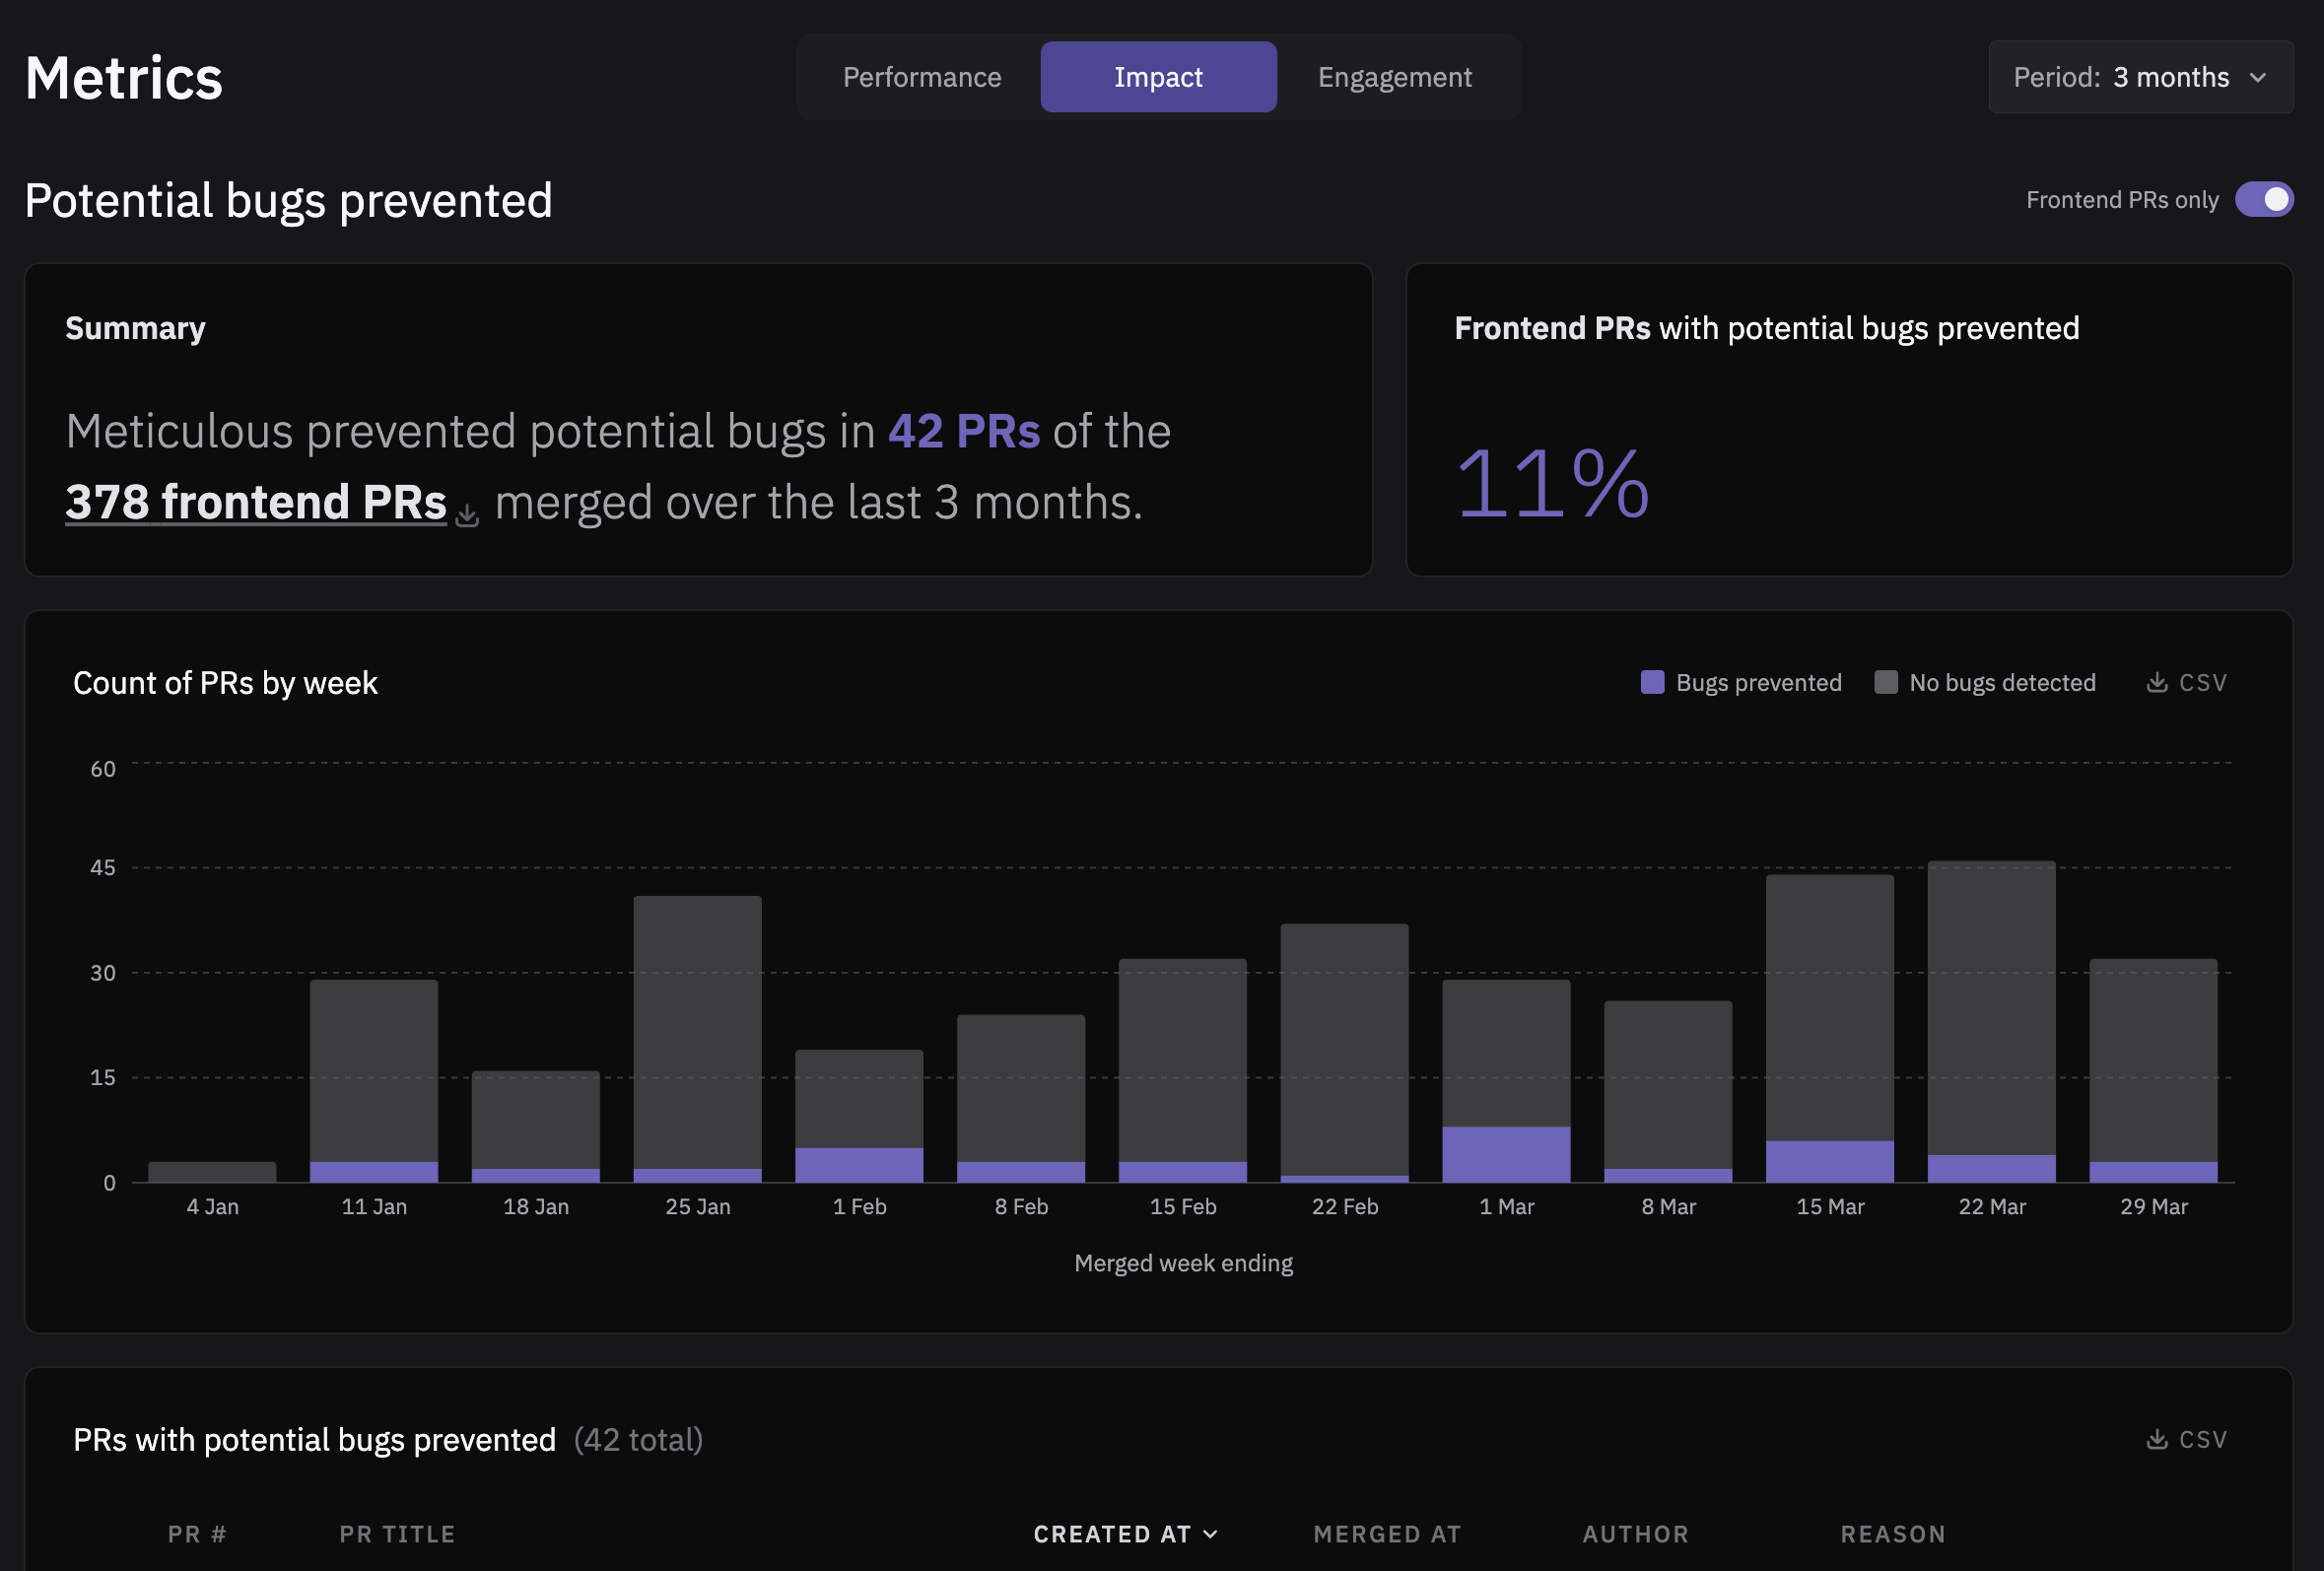
We've built a new dashboard that gives you a bird's-eye view of how Meticulous is performing across your project: track code coverage trends, test run execution time, user engagement and potential bugs that Meticulous has flagged. You can access it from your Meticulous project page.
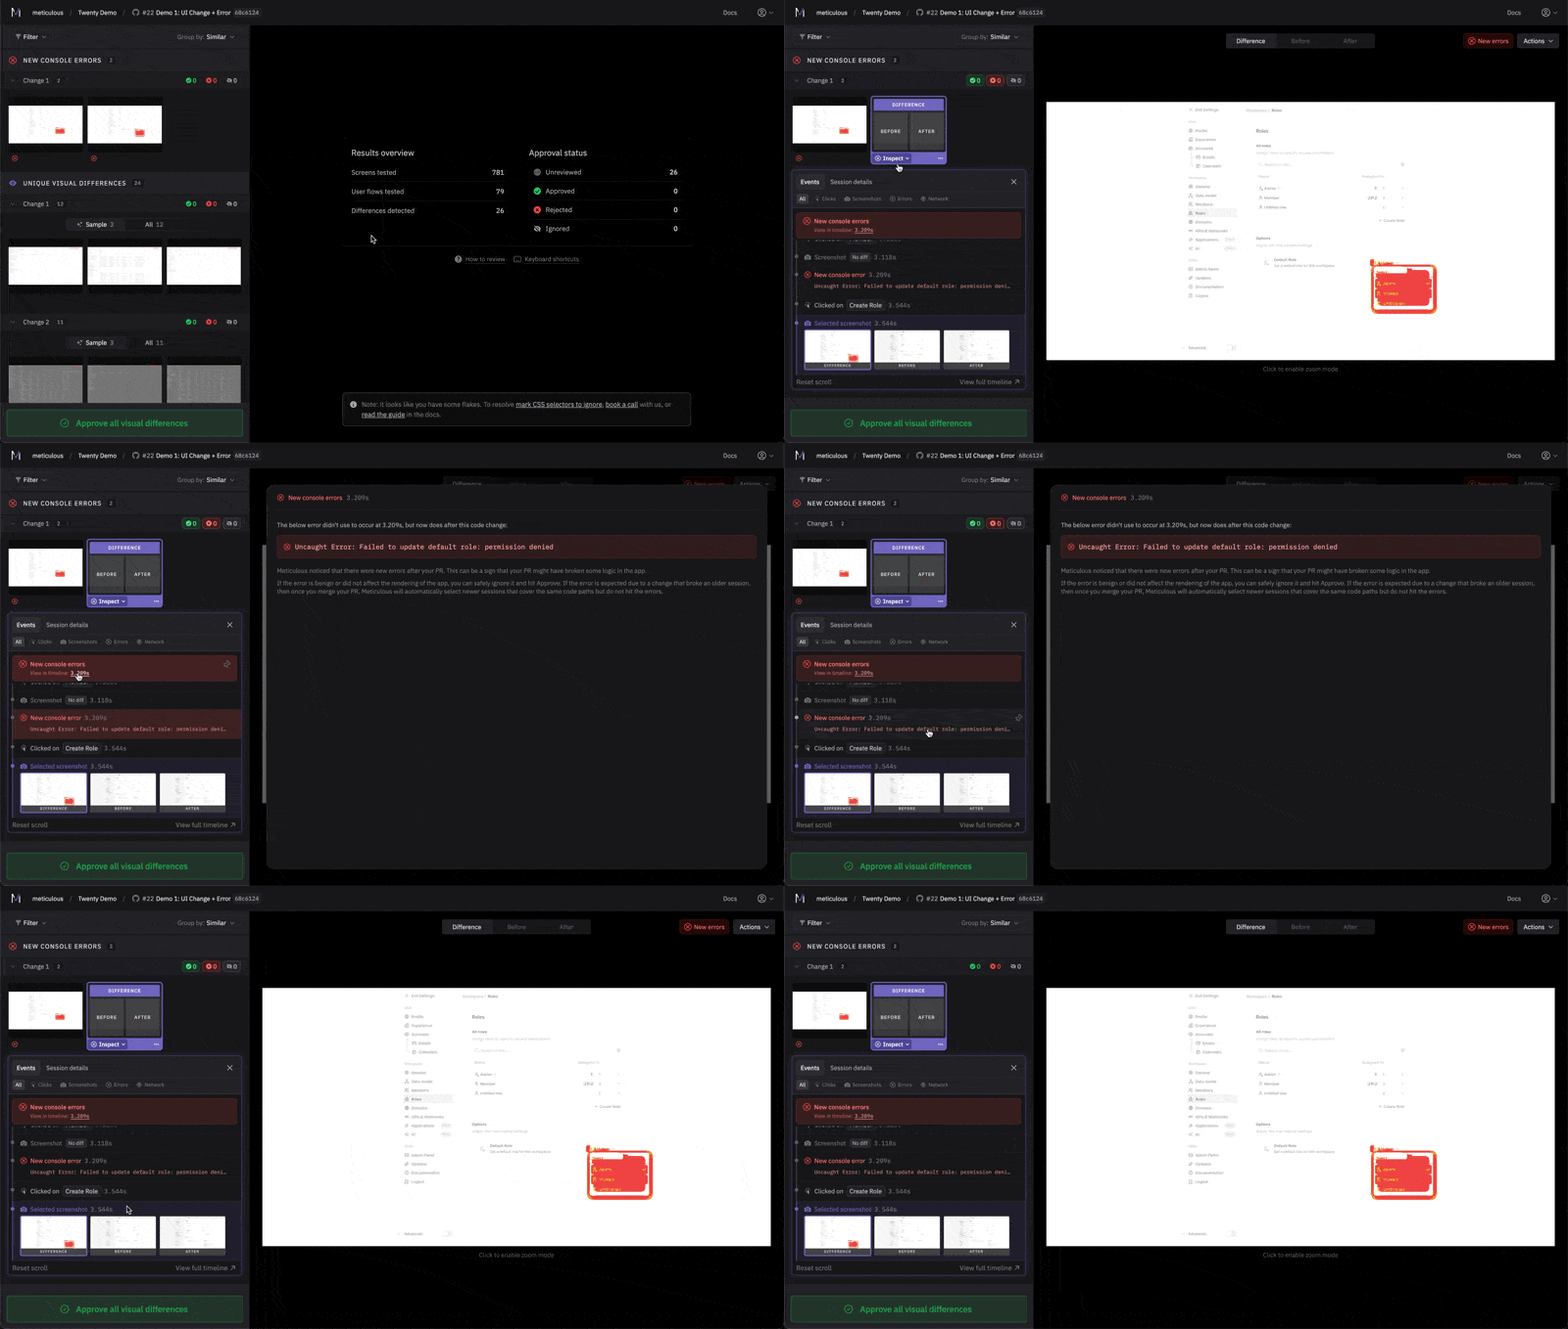
We've rebuilt the timeline sidebar to make the events leading up to a diff much more intuitive, so you're not scrolling through 47 duplicate rows wondering what went wrong in this test run or your life. This is just the beginning of our planned design work to better surface relevant context around each visual difference, so let us know what is and isn't working for you.
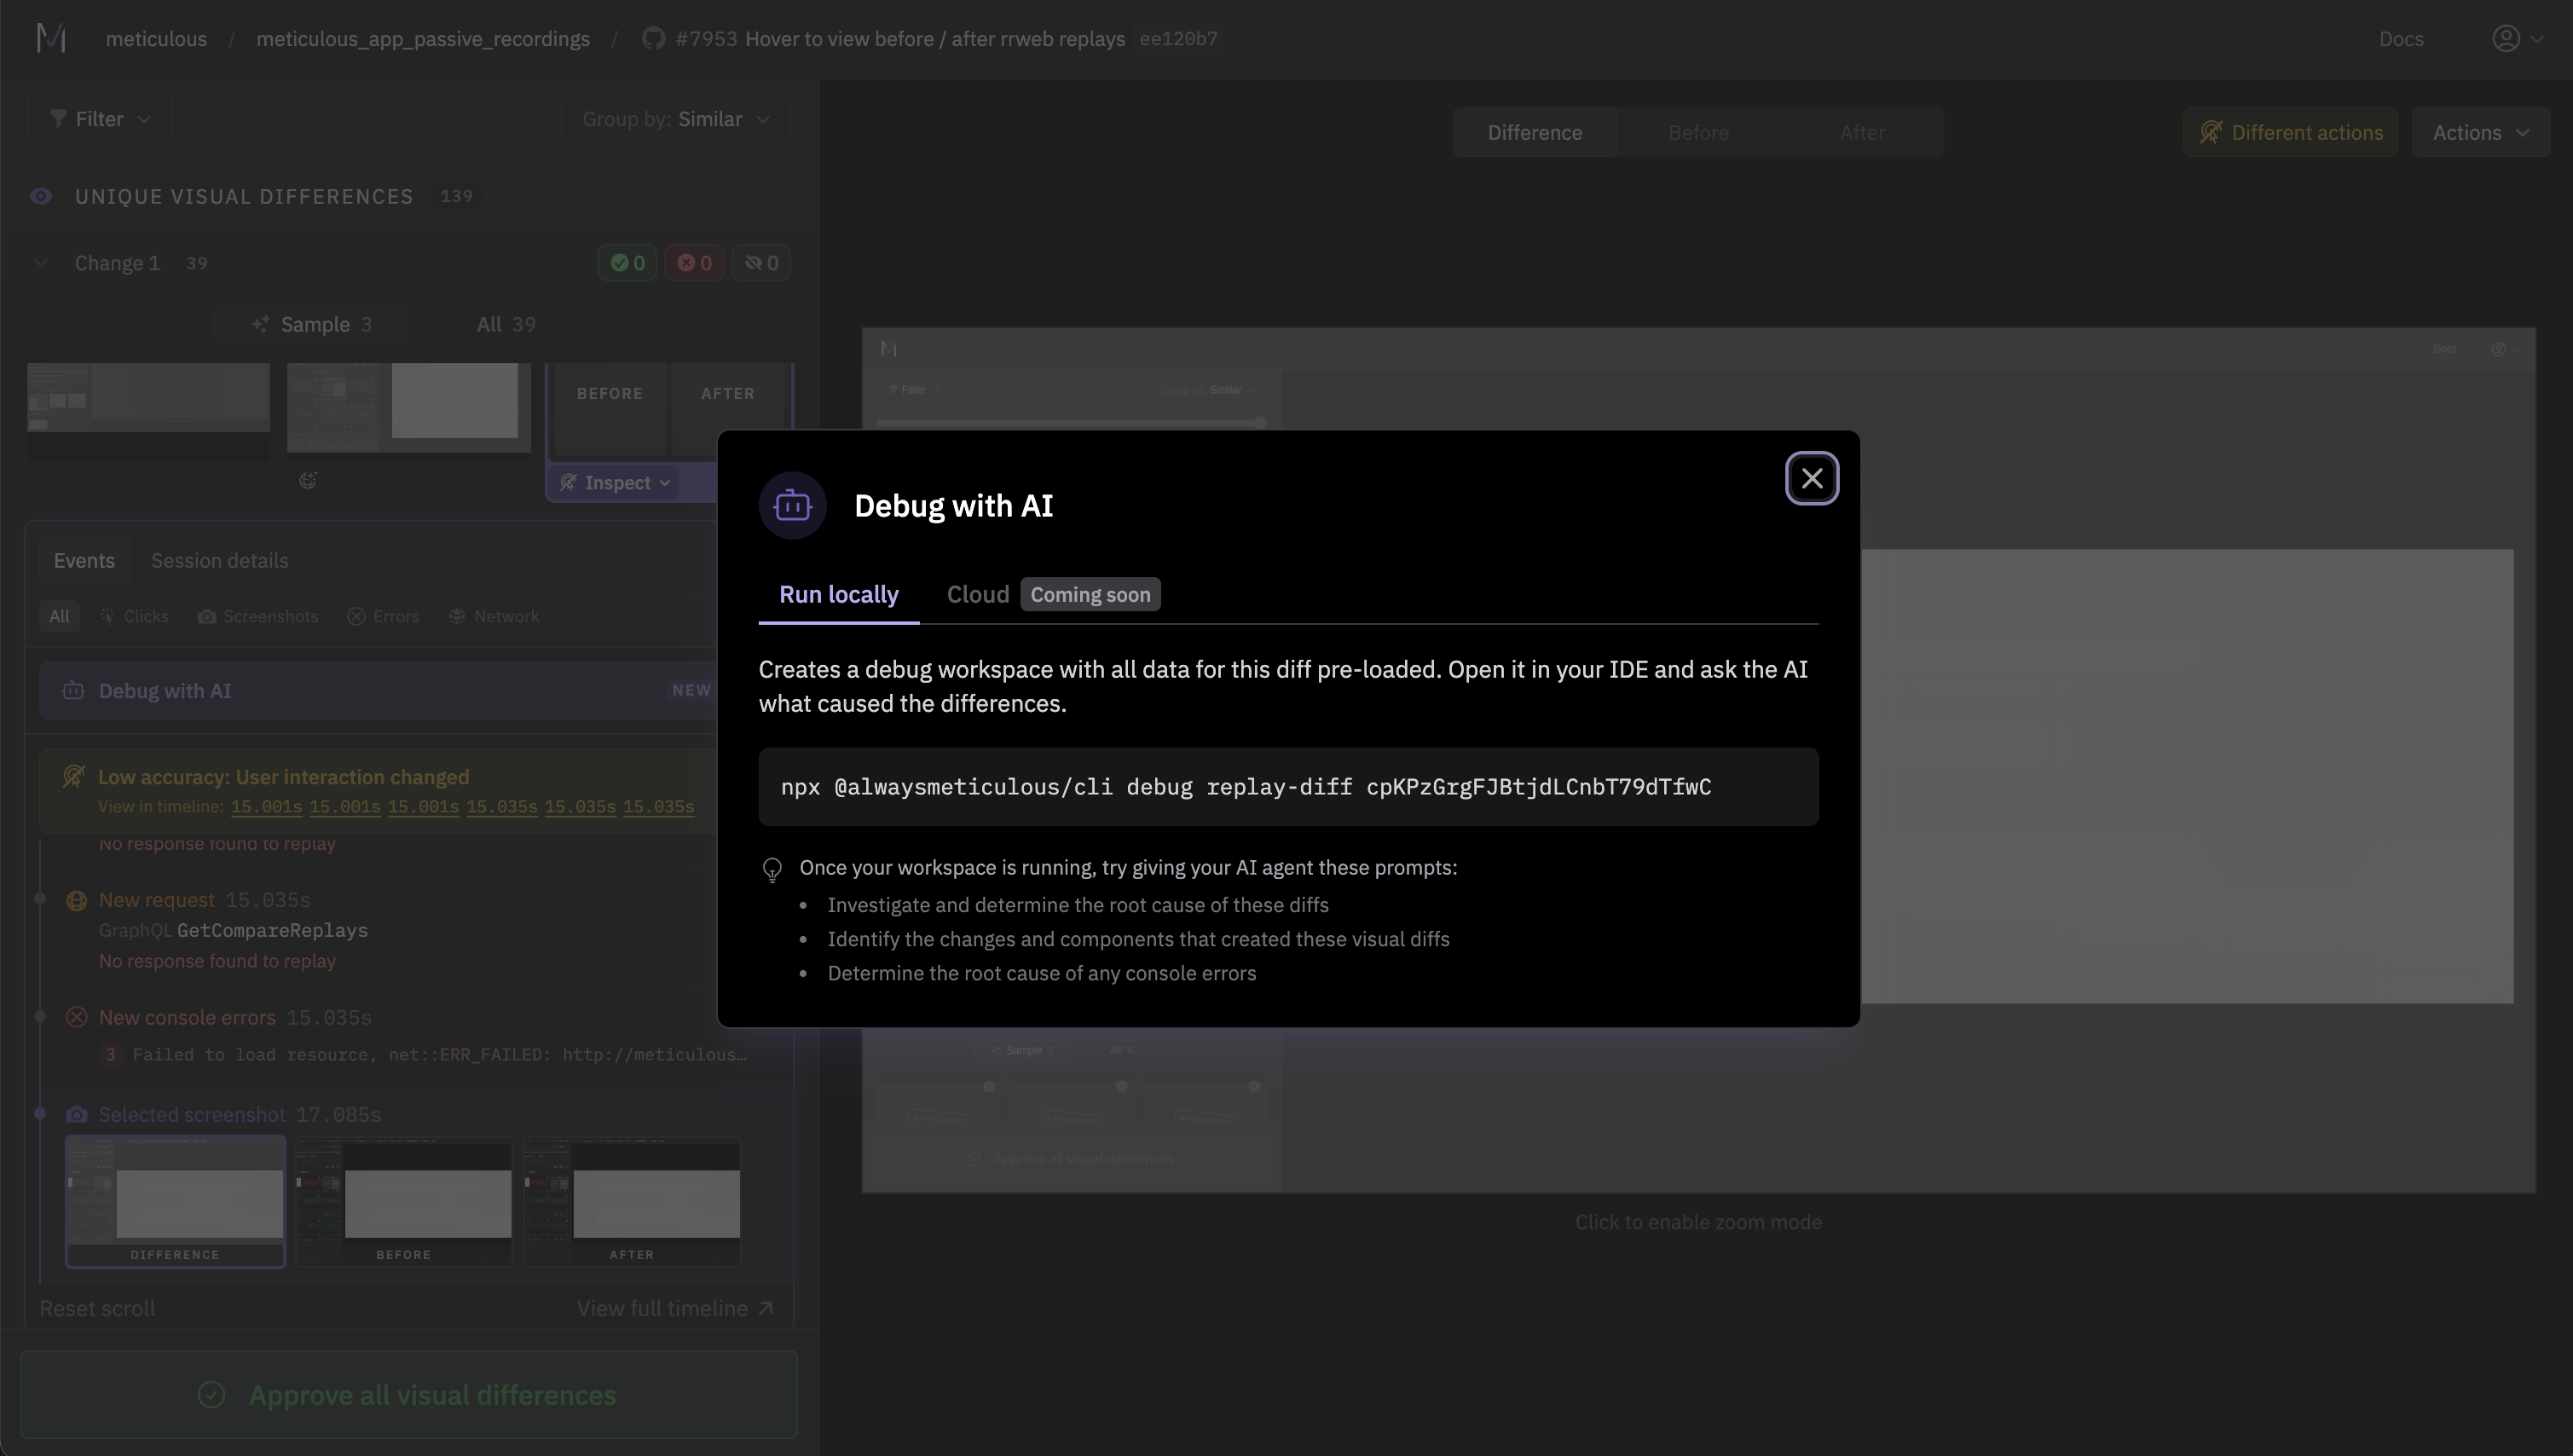
When a test failure has you scratching your head, and even the newly redesigned inspect panel cannot save you, there is now a "Debug with AI" button right in the Meticulous UI. It sets up an AI-assisted debugging workspace, so you can investigate what went wrong without having to piece together CLI commands. Think of it as pair-debugging with someone who already has all the context loaded. If you'd rather give agents direct access to your Meticulous test runs through the CLI, we recommend adding these new skills. We're going deep on agentic workflows - if you have thoughts on what would be most useful, we're all ears.
- 🔗 Combined PR Comments – If you have multiple Meticulous projects in one repo, results now appear in a single PR comment instead of cluttering your PR thread.
- 🧪 Smarter Network Patching – Several improvements to how we match and repair API responses, meaning fewer false diffs caused by stale mocks.
- ⚙️ Self-Serve Network Settings – Request and response size limits (and other settings that used to require contacting us) are now available in your project settings.
- 🧵 Test Runs Threaded by PR – The project test runs page now groups runs by pull request, so older runs collapse under the latest instead of filling your screen.
- 💨 Session Acceleration – We're actively working on making Meticulous test runs faster.